MATH/COSC 3570 Mini Project Presentation
This is the latest version of project guideline. It may be revised later.
The midterm mini project is about data visualization. Show your fun project! Let’s go!! 😎
Timeline and Things to Do
Team up! You will be working as a group of 5 (one team with 4). One of you, please email meyour team member listyour team name (Last year we have team names “Data Dawgs”, “ggplot3”, “GitClub”, “Red Pandas”, “Big Meta Watchers”)
by Friday, 2/28 11:59 PM.Proposal. Please send me a one-page PDF describing what you are going to do for your project (no word limit) with your project title by Friday, 3/7 11:59 PM.Materials. Please share your entire work (slides, code, data, etc) by Wednesday, 3/19 11:59 PM.
Presentation. You will be presenting your project in class on Thursday, 3/20, 2 - 3:15 PM.
[Note]: 03/10 - 03/16 is spring break. Be aware of time, and plan early!
Policy
Team up!
You lose 3 points of your project grade if you don’t meet the requirement or miss the deadline.
You will be randomly assigned to a group if you do not belong to any group before the deadline.
Proposal
Each one of you loses 3 points of your project grade if you don’t meet the requirement or miss the deadline.
Your proposal (in PDF) should include three parts:
- Project title
- Members duty. For example,
- John and Ben: clean data; Mike and Emma: prepare slides; Sophia, Mike, and Ben: plotting, etc.
- The description of the data set you use in your project. For example, what is the data set about, how large is the data, the variables you use for your project, etc. The data set should be one of the data listed in Section 3.1.
- The goal of your project. For example, what are questions you’d like to answer via data visualization? What would you like to learn about and from the data? What variables are you interested?
Although it is risky, you can change your project topic after you submit your proposal if you decide to do something else.
Materials
Each one of you loses 3 points of your project grade if you don’t meet the requirement or miss the deadline.
You need to share your entire work, including slides, code, etc so that anyone is able to reproduce your outputs and plots shown in the slides.
The code must be shared via a Quarto file.
Presentation
- Each group presentation is about 5 and 6 minute long, followed by about 1 minute Q&A. If your presentation is too short or too long, every one of you loses 3 points of your project grade.
Project Content, Evaluation and Grading
The goal of the project is data visualization. Through this project, you use charts to provide insights and explore patterns, trends, or other relationships between variables that may benefit decision making. For example, you find that NBA players with higher 3pt percentage tend to earn more, but free throw percentage seems has no effect on player’s salary.
You presentation should include the following aspects.
Data and variable explanation. Which data you use? What variables you are choosing for visualization? Why choose those variables?
Visualization. Include at least two different charts to show your data. Make them beautiful and informative.
Interpretation and Insights. What do you learn from your charts? Explain your plots, and provide useful insights.
Your slides quality and oral presentation and clarity will also be evaluated. Please see Section 3.2 for more grading details.
Data
The available data sets for this projects can be downloaded from kaggle, a data science competition platform sharing various data and projects. Please choose one data set for your project from the following:
[Note:] Those are real data sets that contains many observations and variables. You just need to pick a few variables for plotting and analysis.
[Note:] You may use some other data, but the data set cannot be the one used in the course (like ggplot2::mpg). The data set needs to be as sophisticated as the listed data sets above. Dr. Yu and TA will evaluate your data quality.
Evaluation and Grading
- Your project performance is evaluated by Dr. Yu and the TA that is based on the following rubric:
| Criteria | Excellent | Good | Fair | Emerging |
|---|---|---|---|---|
| Data Understanding (15%) | Clearly explains the dataset, its source, and key variables. Provides meaningful insights. | Shows good understanding with clear explanations and some strong insights. A few minor details could be expanded. | Shows a basic grasp of the dataset but needs more clarity or depth in explaining its significance and insights. | Needs further understanding of the dataset. More details and insights would strengthen the analysis. |
| Visualization Quality (30%) | Visualizations are clear, well-chosen, and enhance understanding. Thoughtful design choices make the data engaging and accessible. | Strong visuals that support the data well. Some minor refinements could improve clarity or impact. | Basic visuals that convey information but could be more refined or better suited to the dataset. | Needs improvement in visualization selection or clarity. More attention to detail will enhance effectiveness. |
| Output Interpretation and Insights (25%) | Thoughtful and well-supported insights demonstrate strong analytical skills. Patterns and trends are clearly explained with compelling interpretations. | Provides solid insights with good explanations. Some areas could benefit from deeper analysis. | Insights are present but may lack depth or clear connections to the data. Some interpretations need more support. | Insights need further development. Strengthening data interpretation will enhance overall understanding. |
| Slides quality (15%) | Slides are visually appealing, well-organized, and complement the spoken presentation. Effective use of text, images, and color enhances clarity. | Slides are clear and well-structured but could be slightly improved in design or organization. | Slides contain useful content but may be text-heavy, cluttered, or lack visual appeal. | Slides need better organization and design to support the presentation effectively. |
| Presentation Clarity and Interaction (15%) | The presentation is well-organized, engaging, and confident. The team communicates ideas effectively and transitions smoothly. | A well-structured and clear presentation. Minor adjustments could improve flow or engagement. | The presentation is understandable but could be more organized or engaging. Some transitions may be unclear. | More practice and organization will help improve clarity and engagement. |
- Your project grade will be
Project grade = performance grade - points lost due to violation of policy
with adjustement based on your performance of duty.
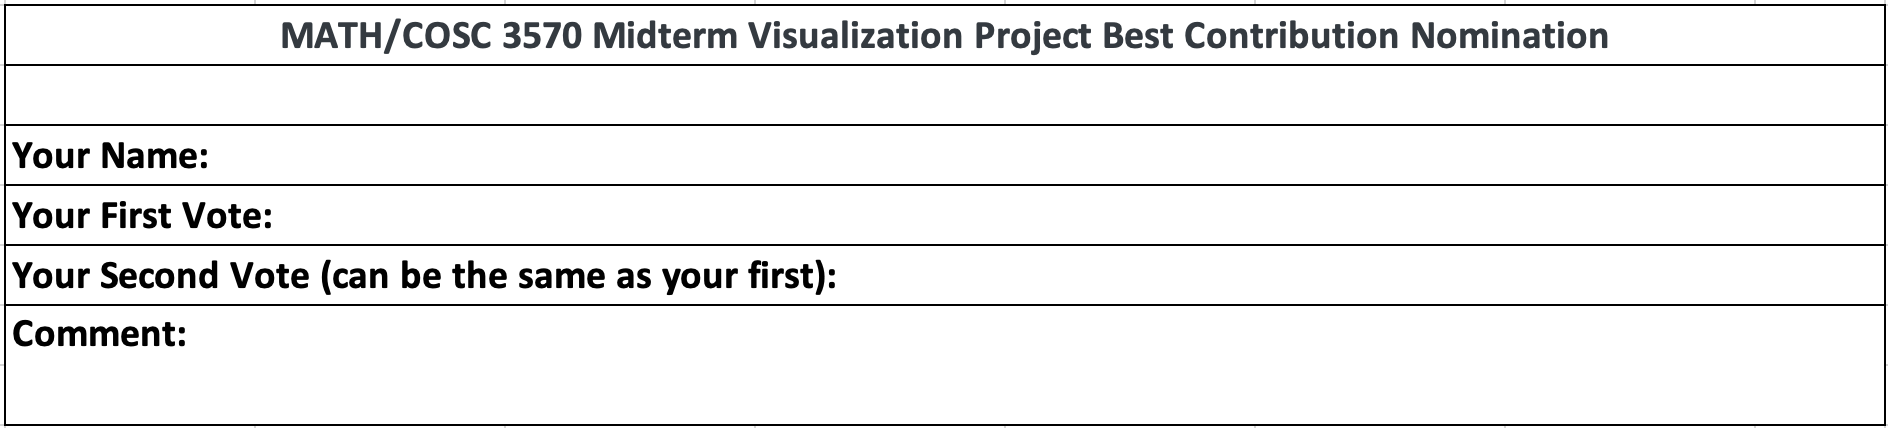
Peer Individual Performance Evaluation
In each team, two group members will win the best contribution reward that add extra points to the project grade.
Each one of you has two votes to nominate one or two of your teammates who you think contribute the most to your group project.
You can nominate
- two teammates, each receiving one vote.
- one teammate who receives two votes.
You cannot nominate yourself.
If you don’t vote, or you just use one vote, you can’t be the best contributor even if you receive the most or 2nd highest votes. The member with the 2nd or 3rd highest votes wins the best contribution reward.
If there are more than two group members receive top two number of votes, Dr. Yu and the TA will decide the final top two nominees. For example, if John receives the most votes, and Emma and Amy both receive the 2nd highest votes, Dr. Yu and the TA choose either Emma or Amy for the reward.