diamond_color <- readr::read_csv("the url")Lab 16: Joining tables
Note
In lab.qmd ## Lab 16 section
- Import the data at https://www.jaredlander.com/data/DiamondColors.csv. Call it
diamond_color.
- Use
left_join()to combine the data setdiamondsin ggplot2 anddiamond_colorby the key variablecolor.
- Select the variables
carat,color,Description,Details.
## Variable "color" in diamonds but "Color" in diamond_color

joined_df <- diamonds |>
    _______(_______, by = c('color' = 'Color')) |>  ## join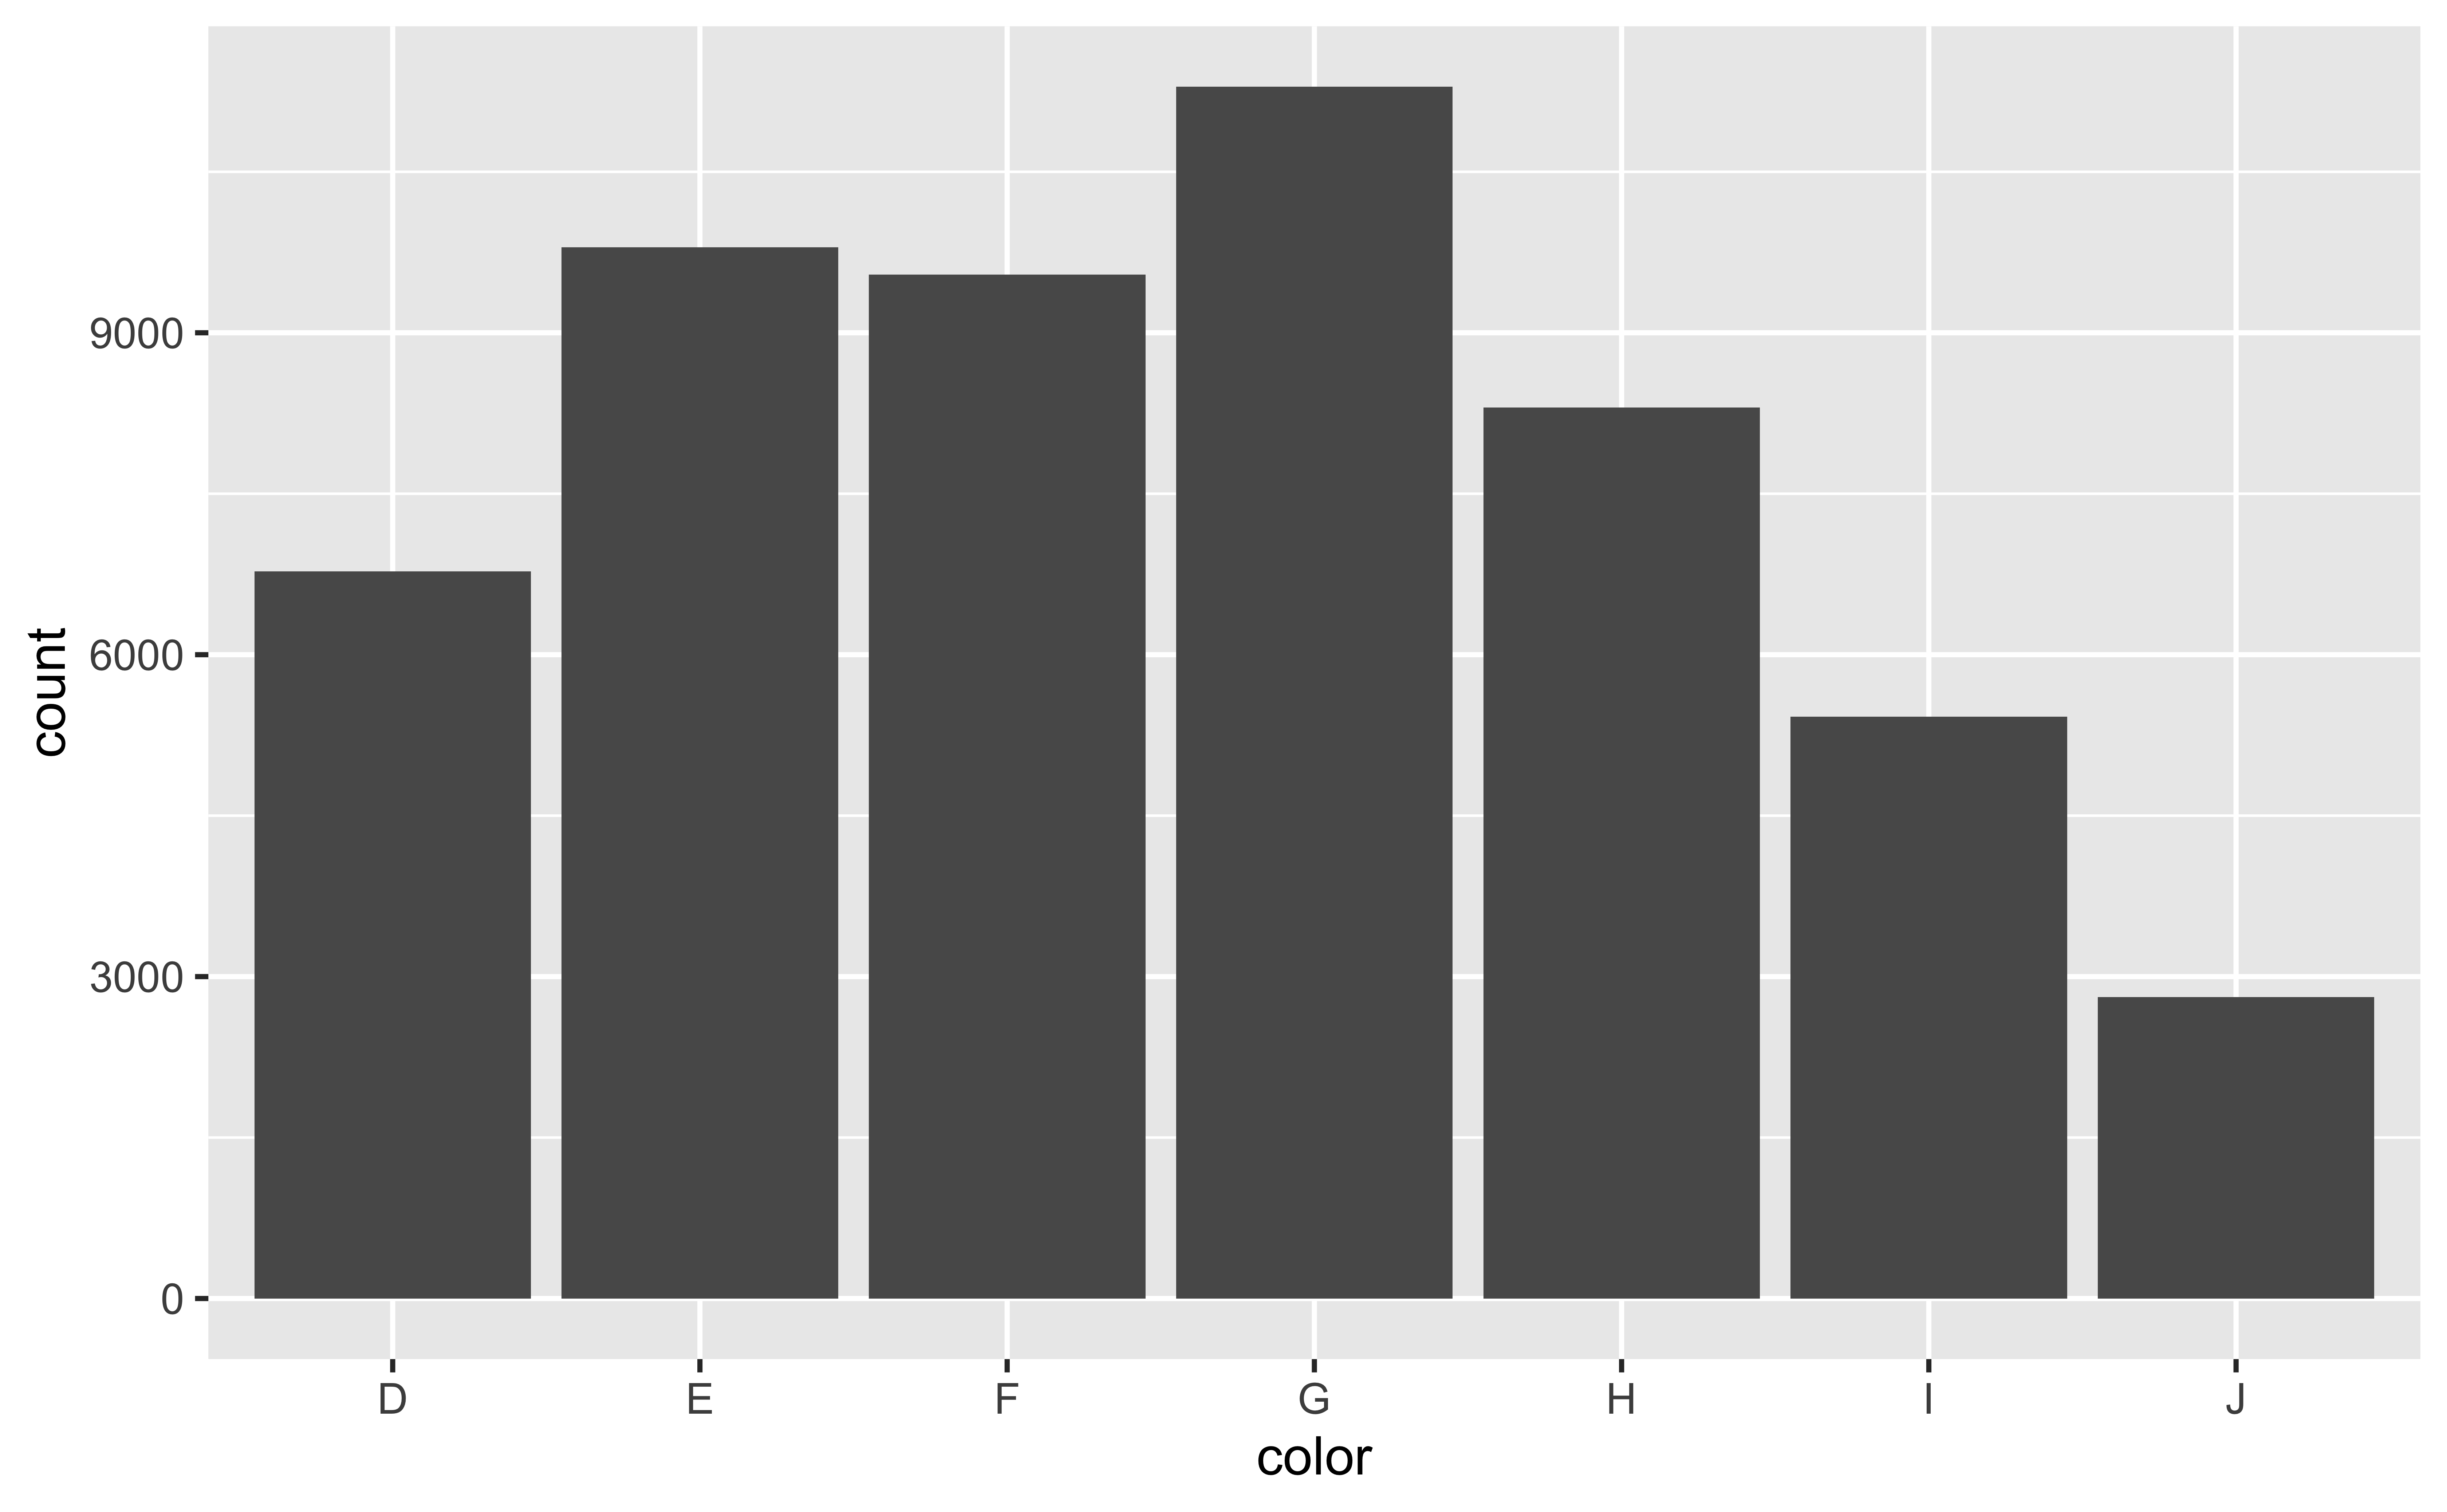
_______(_________________________________________) ## select- Create a bar chart of the variable
color.
# A tibble: 53,940 × 4
   carat color Description    Details
   <dbl> <chr> <chr>          <chr>
 1  0.23 E     Colorless      Minute traces of color
 2  0.21 E     Colorless      Minute traces of color
 3  0.23 E     Colorless      Minute traces of color
 4  0.29 I     Near Colorless Slightly detectable color
 5  0.31 J     Near Colorless Slightly detectable color
 6  0.24 J     Near Colorless Slightly detectable color
 7  0.24 I     Near Colorless Slightly detectable color
 8  0.26 H     Near Colorless Color is dificult to detect
 9  0.22 E     Colorless      Minute traces of color
10  0.23 H     Near Colorless Color is dificult to detect
# ℹ 53,930 more rows