Lab 13: Visualization
Note
In lab.qmd ## Lab 13 section,
Import the data penguins.csv.
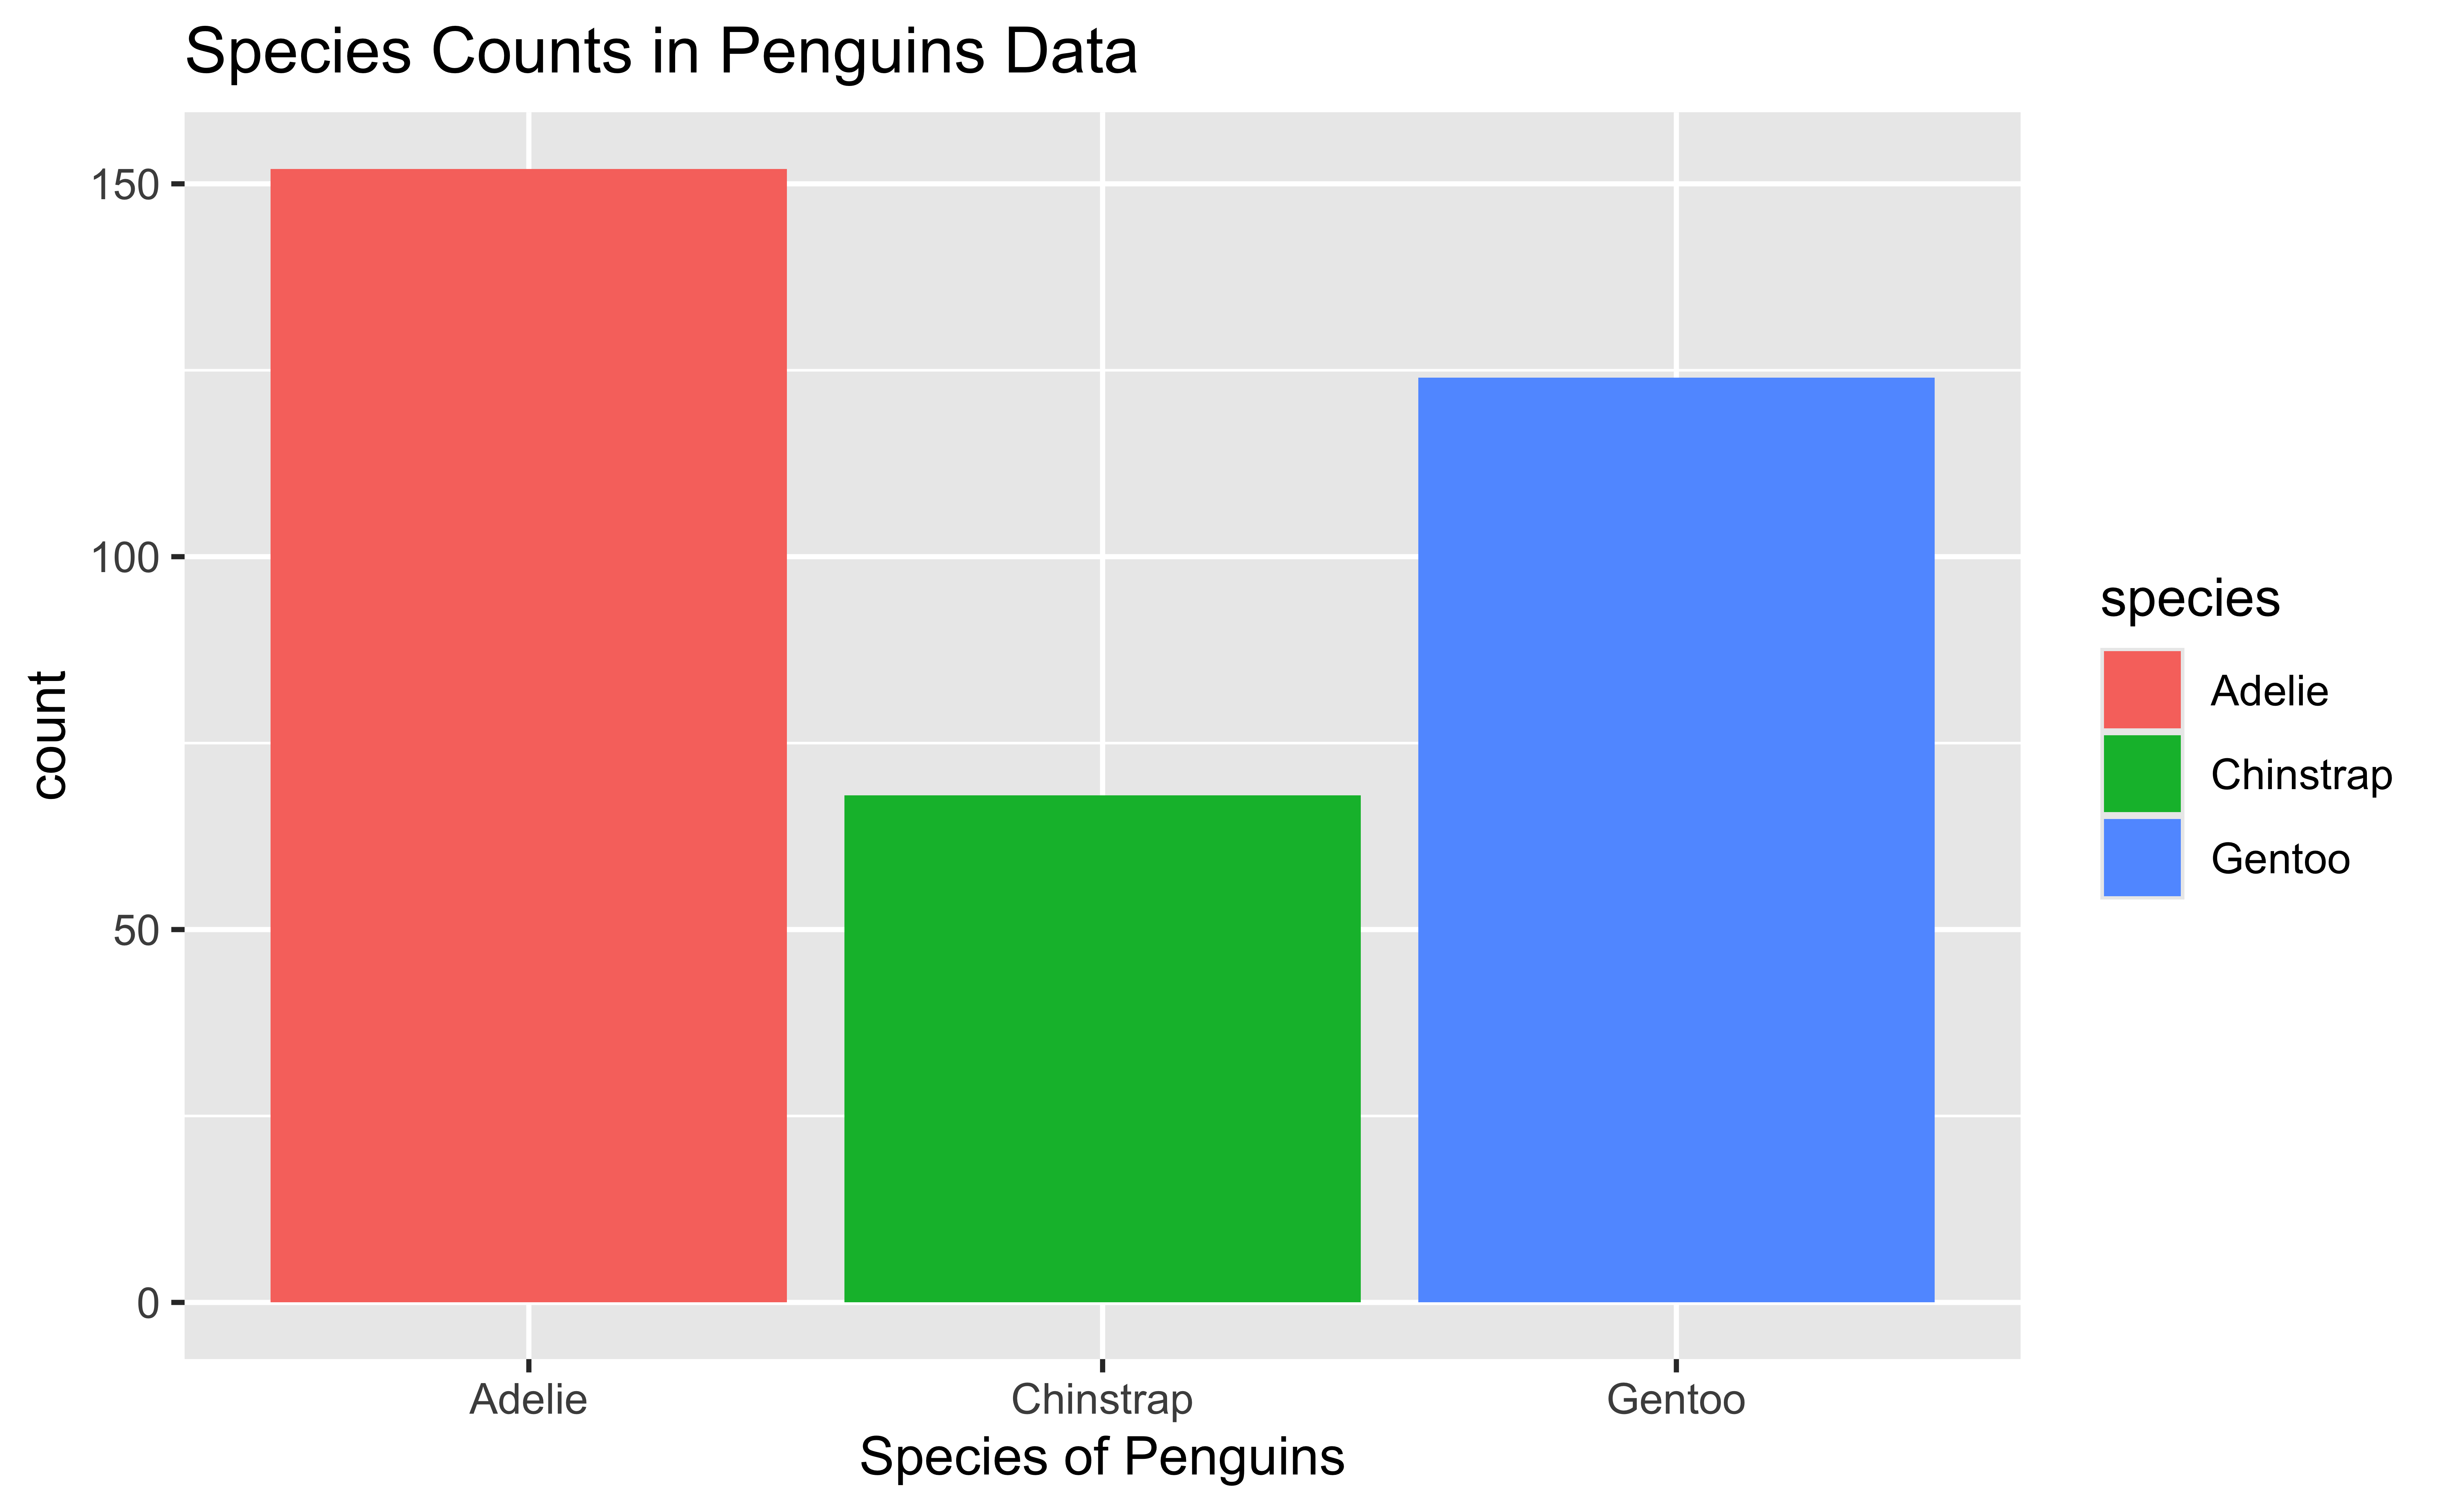
Generate the following
Warning: Removed 2 rows containing non-finite outside the scale range
(`stat_bin()`).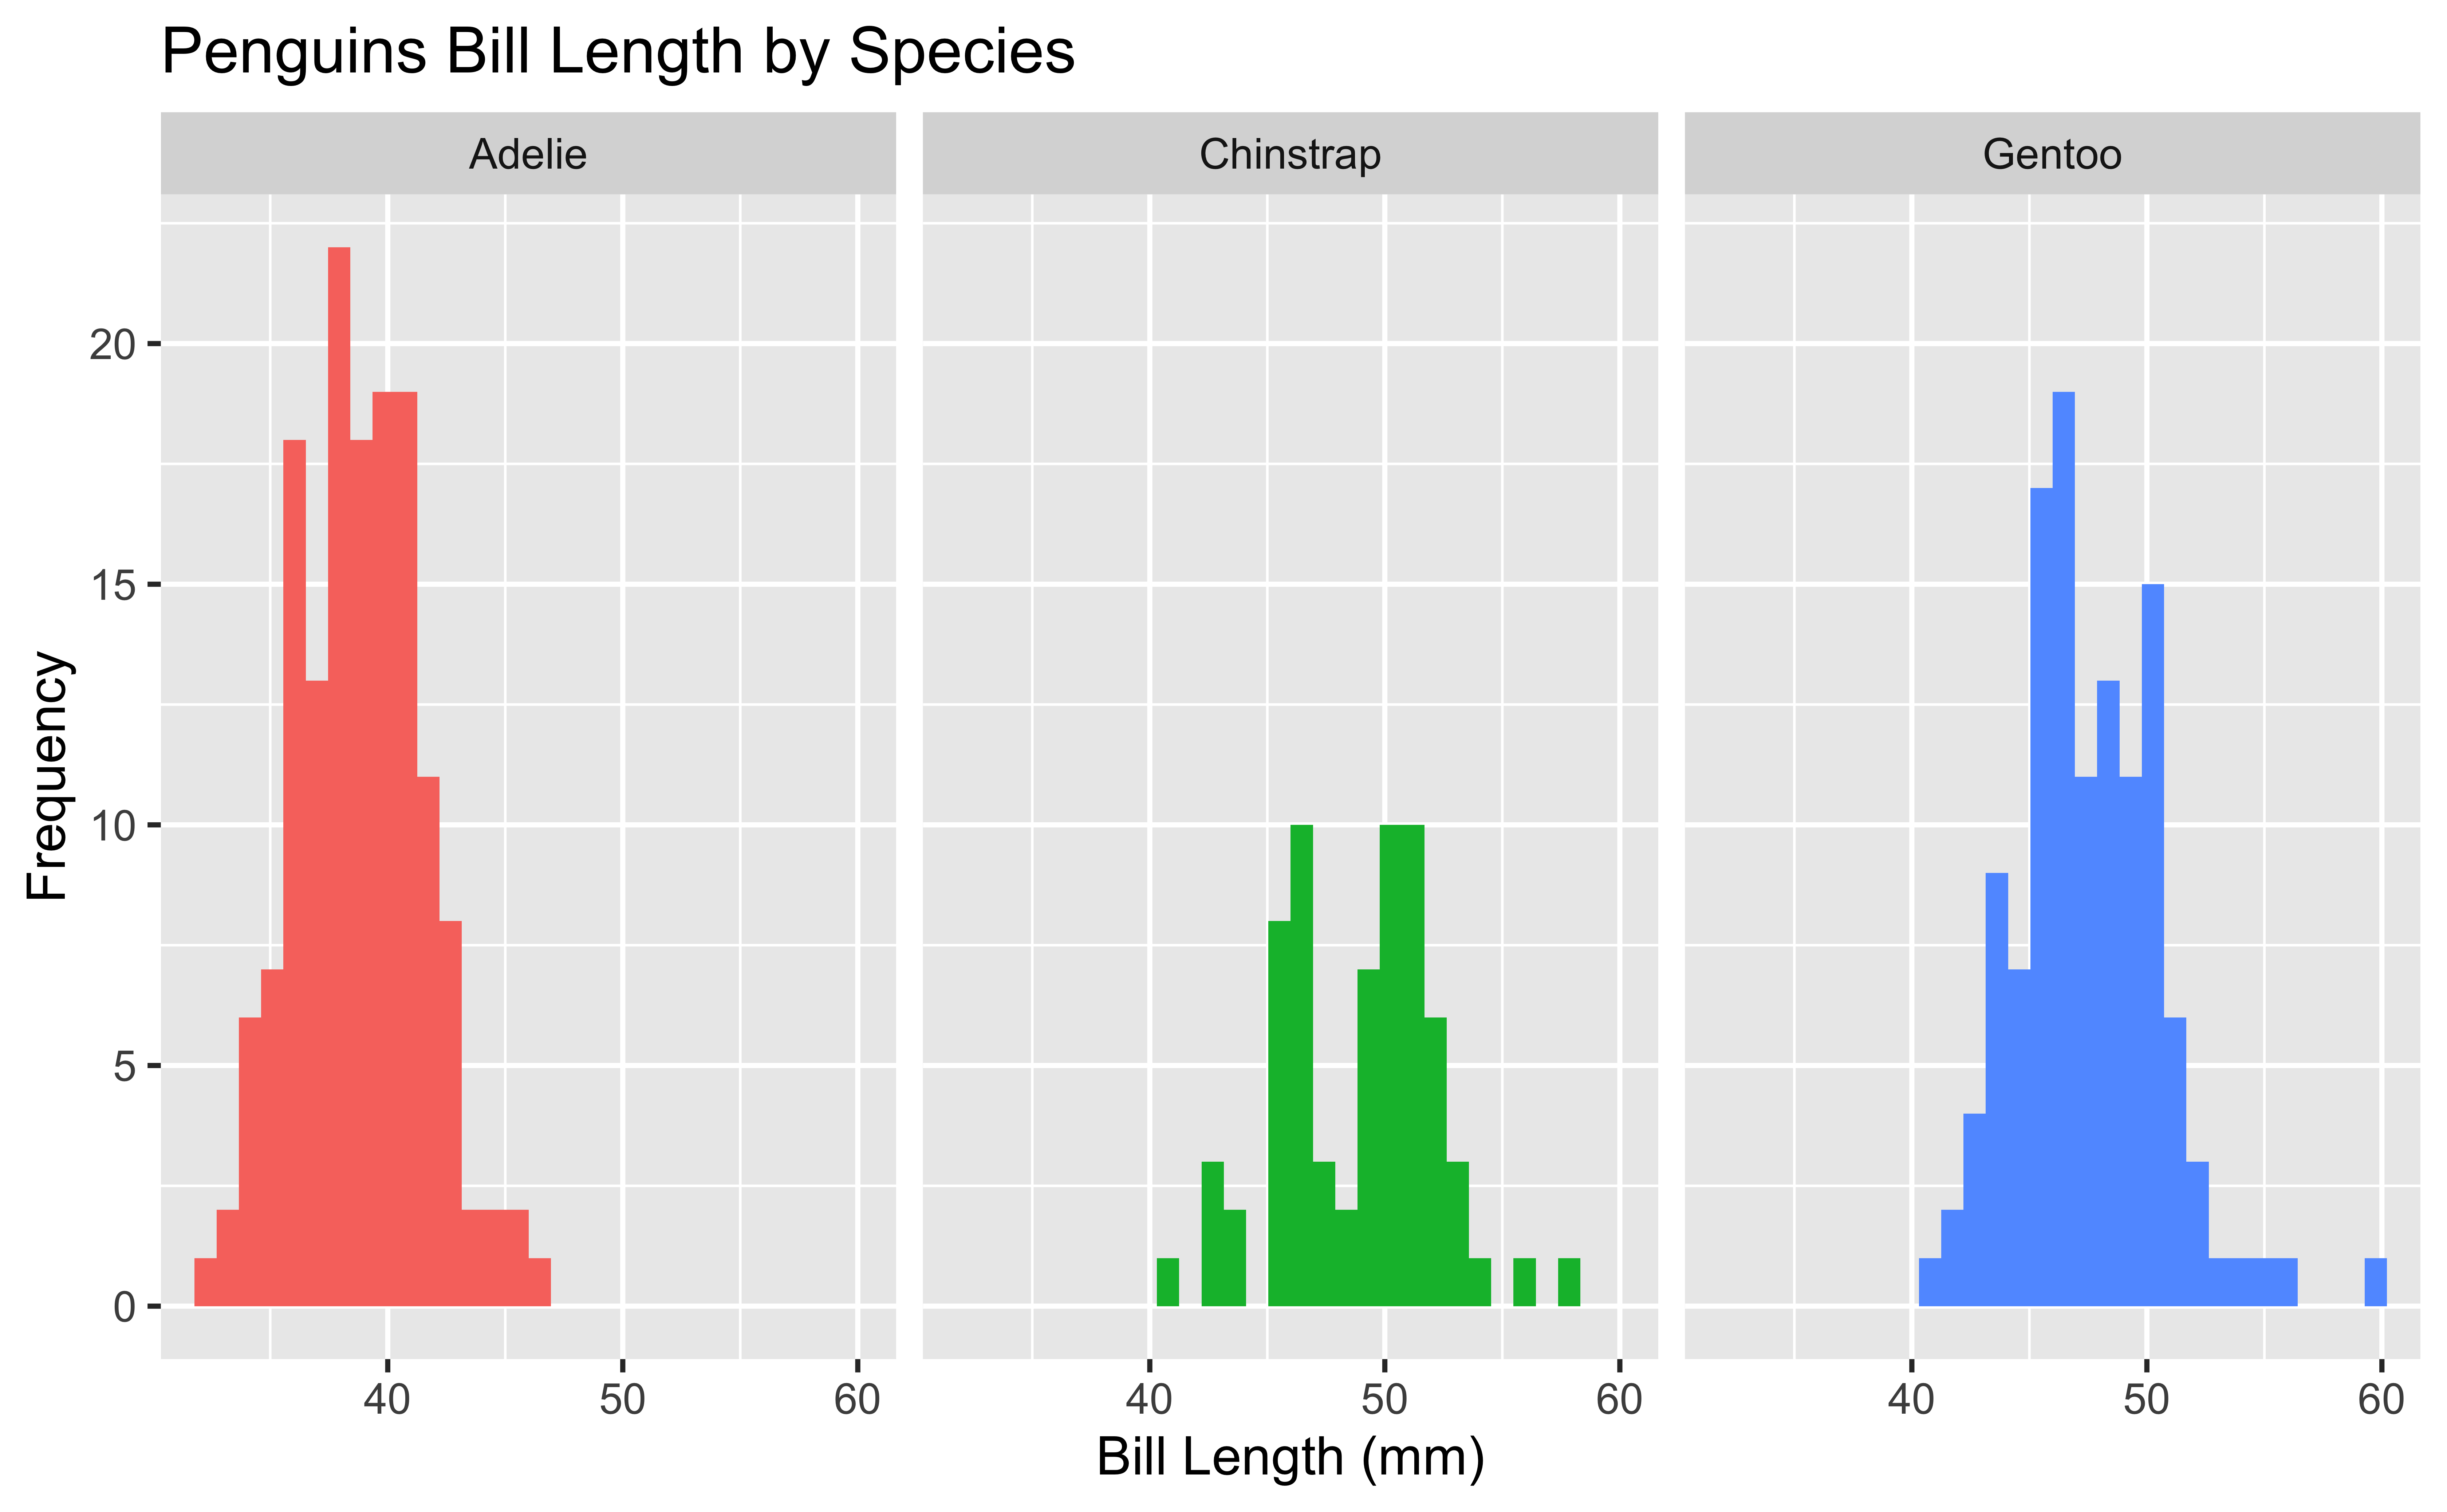
# library(tidyverse)
penguins <- read_csv(__________________)
________ |> ggplot(_______________________) +  ## mapping layer
    ___________________ +  ## geometry layer
    _____________________________  ## label layer
________ |> ggplot(______________________________) +  ## mapping layer
    _______________ +  ## geometry layer
    _______________ +  ## label layer
    ______________________________  +   ## facet layer
    ______________________________      ## theme layer (set legend.position = "none")