Lab 07: Plotting
Note
In lab.qmd ## Lab 7,
- For the
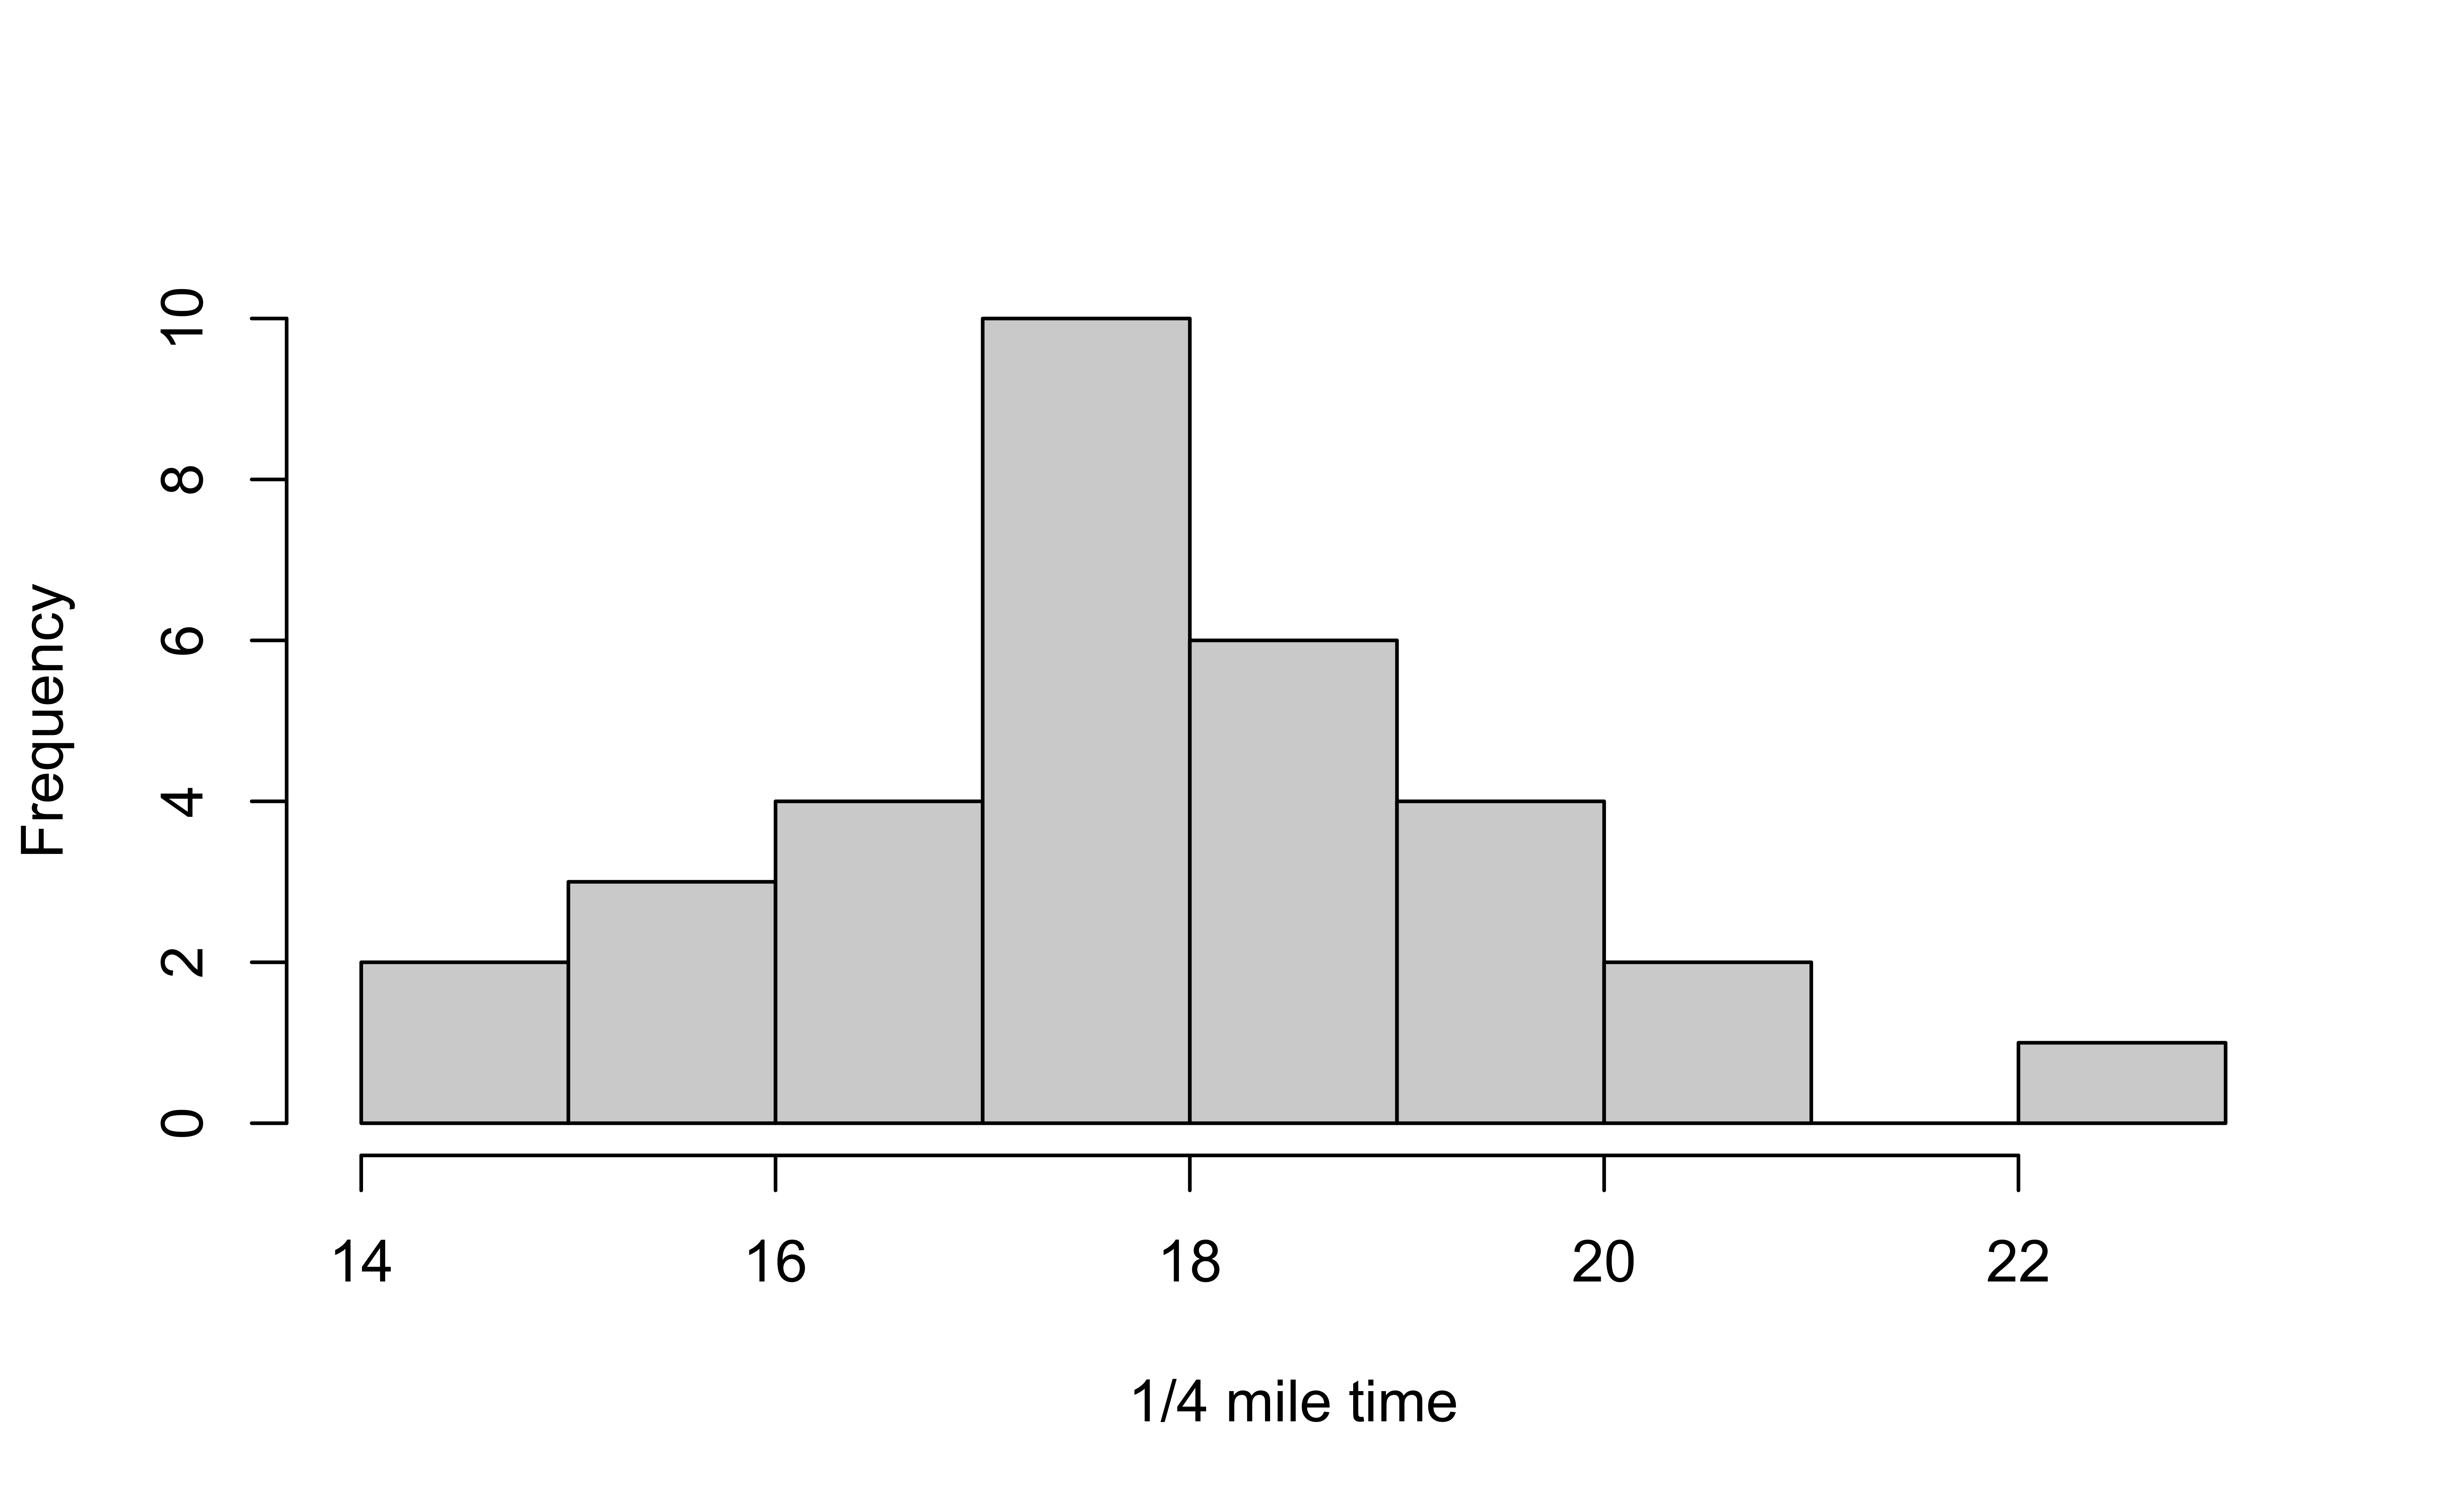
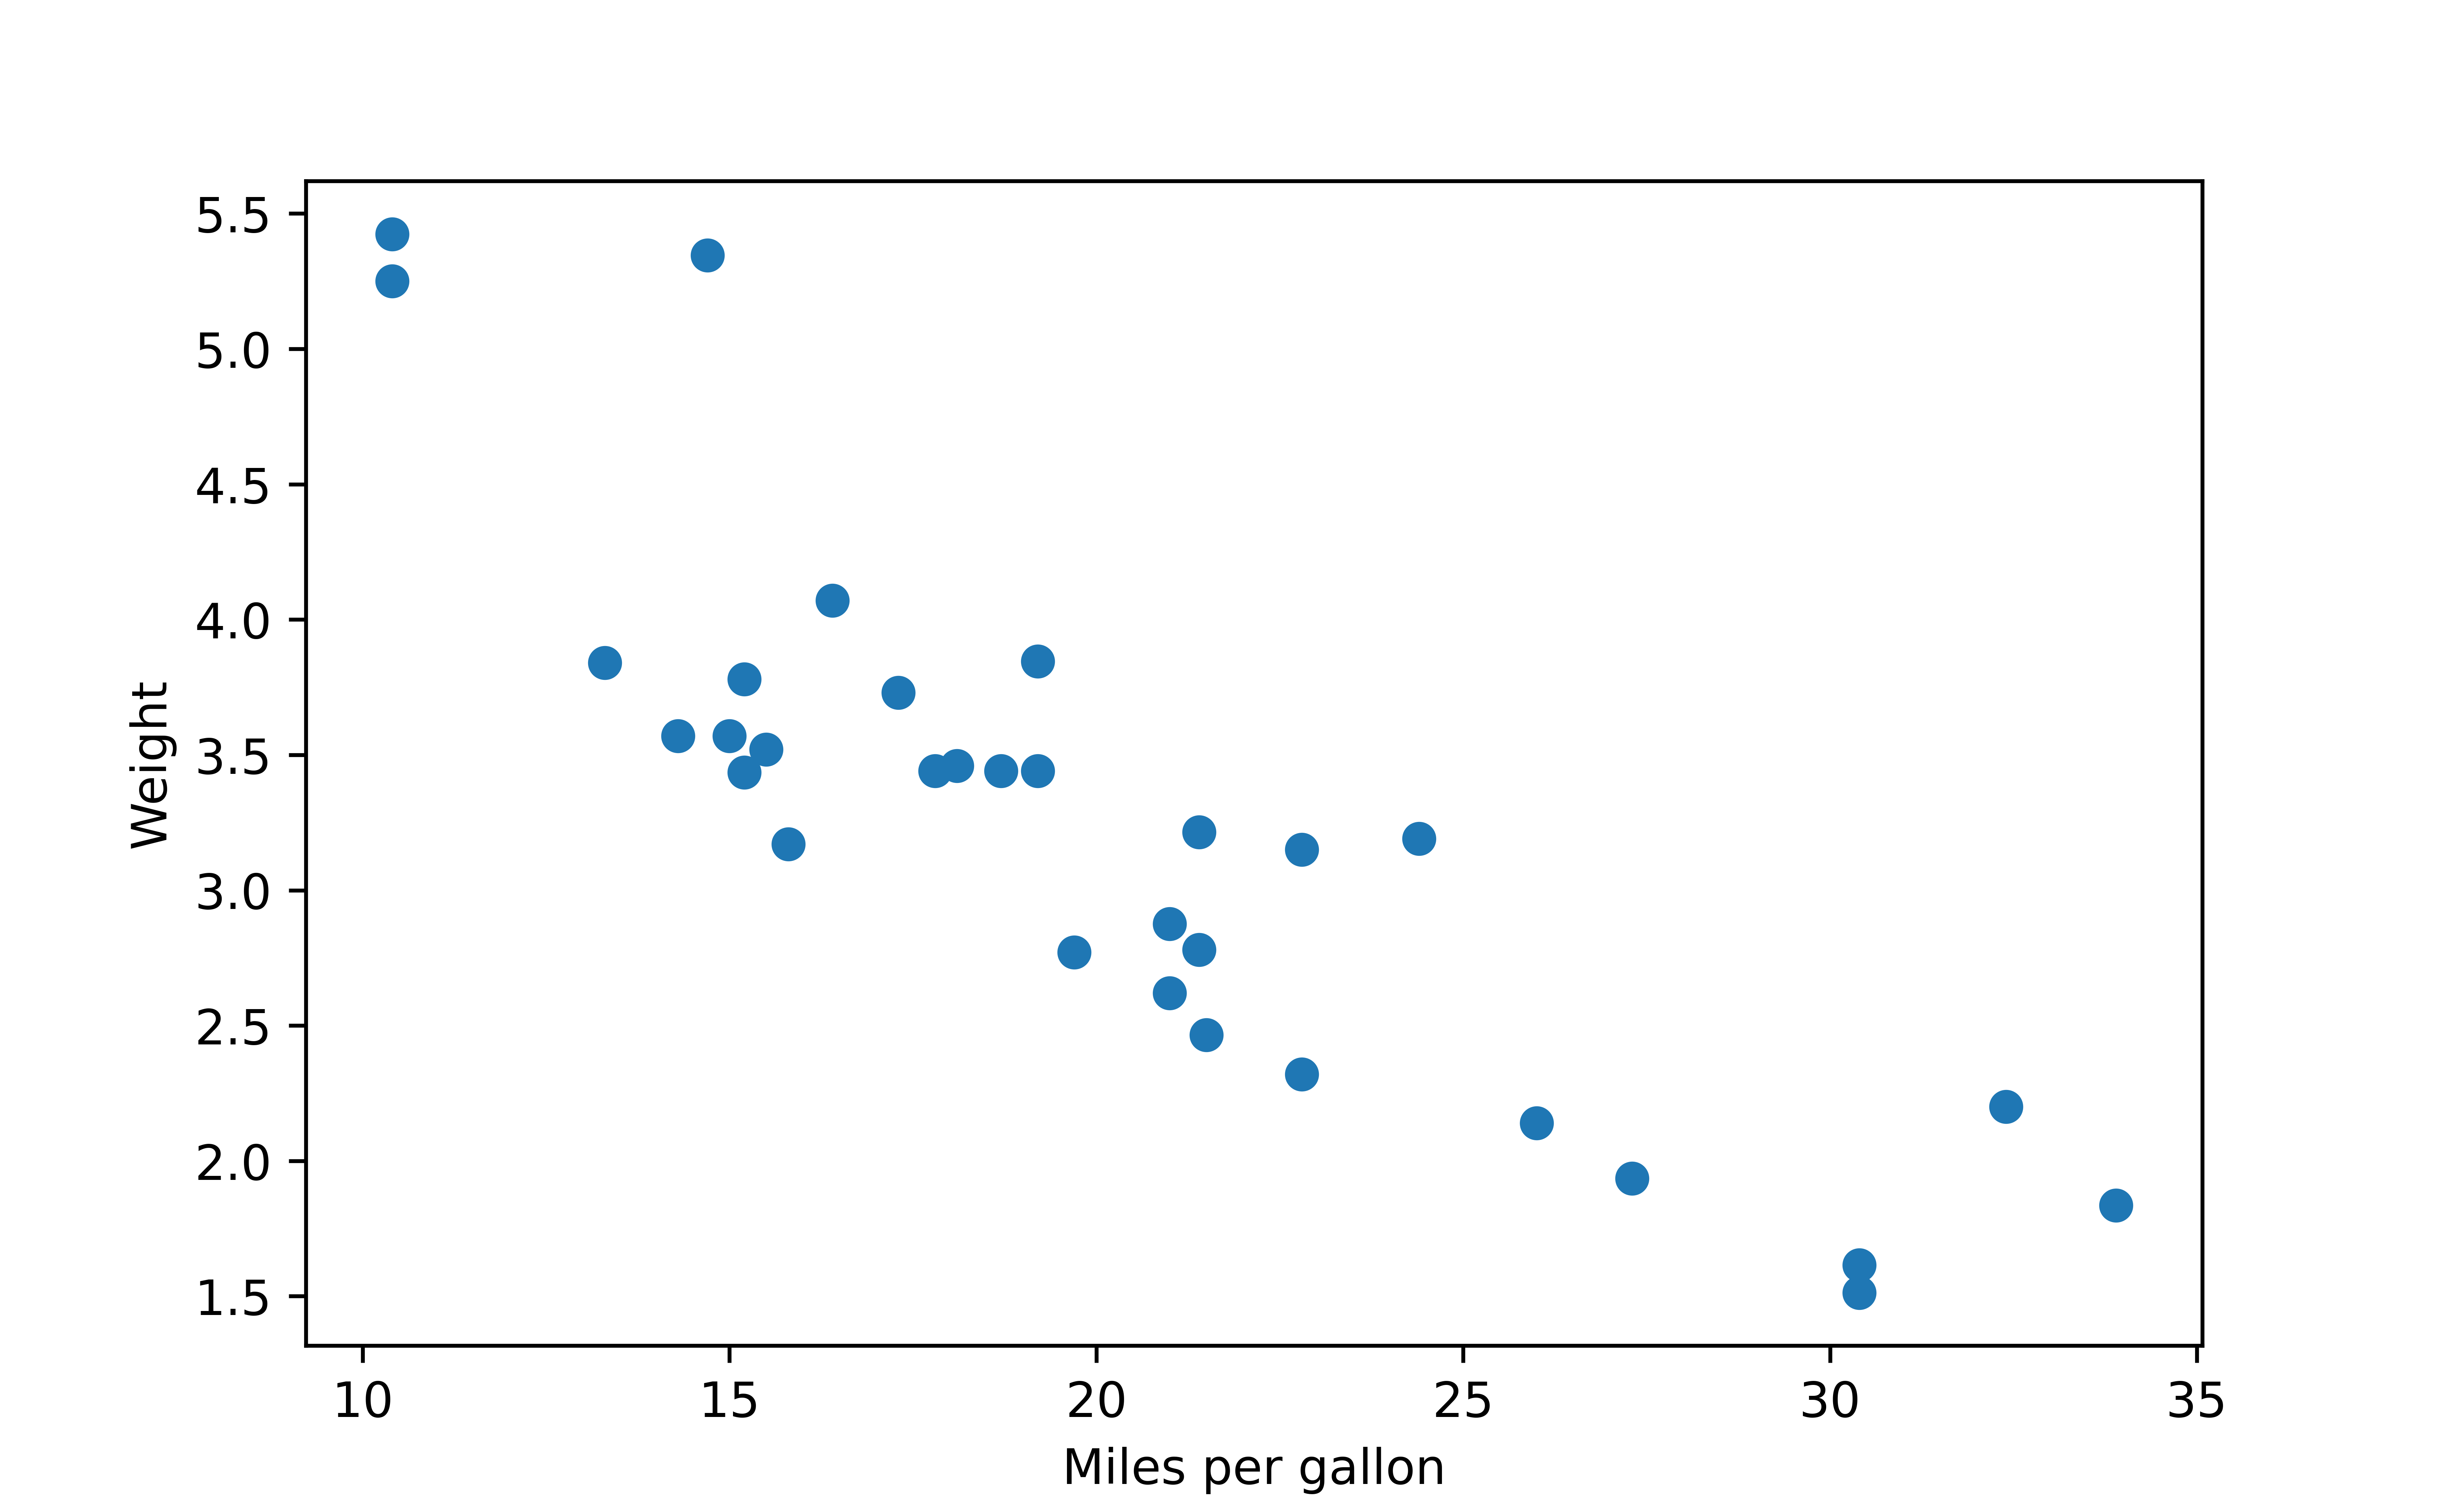
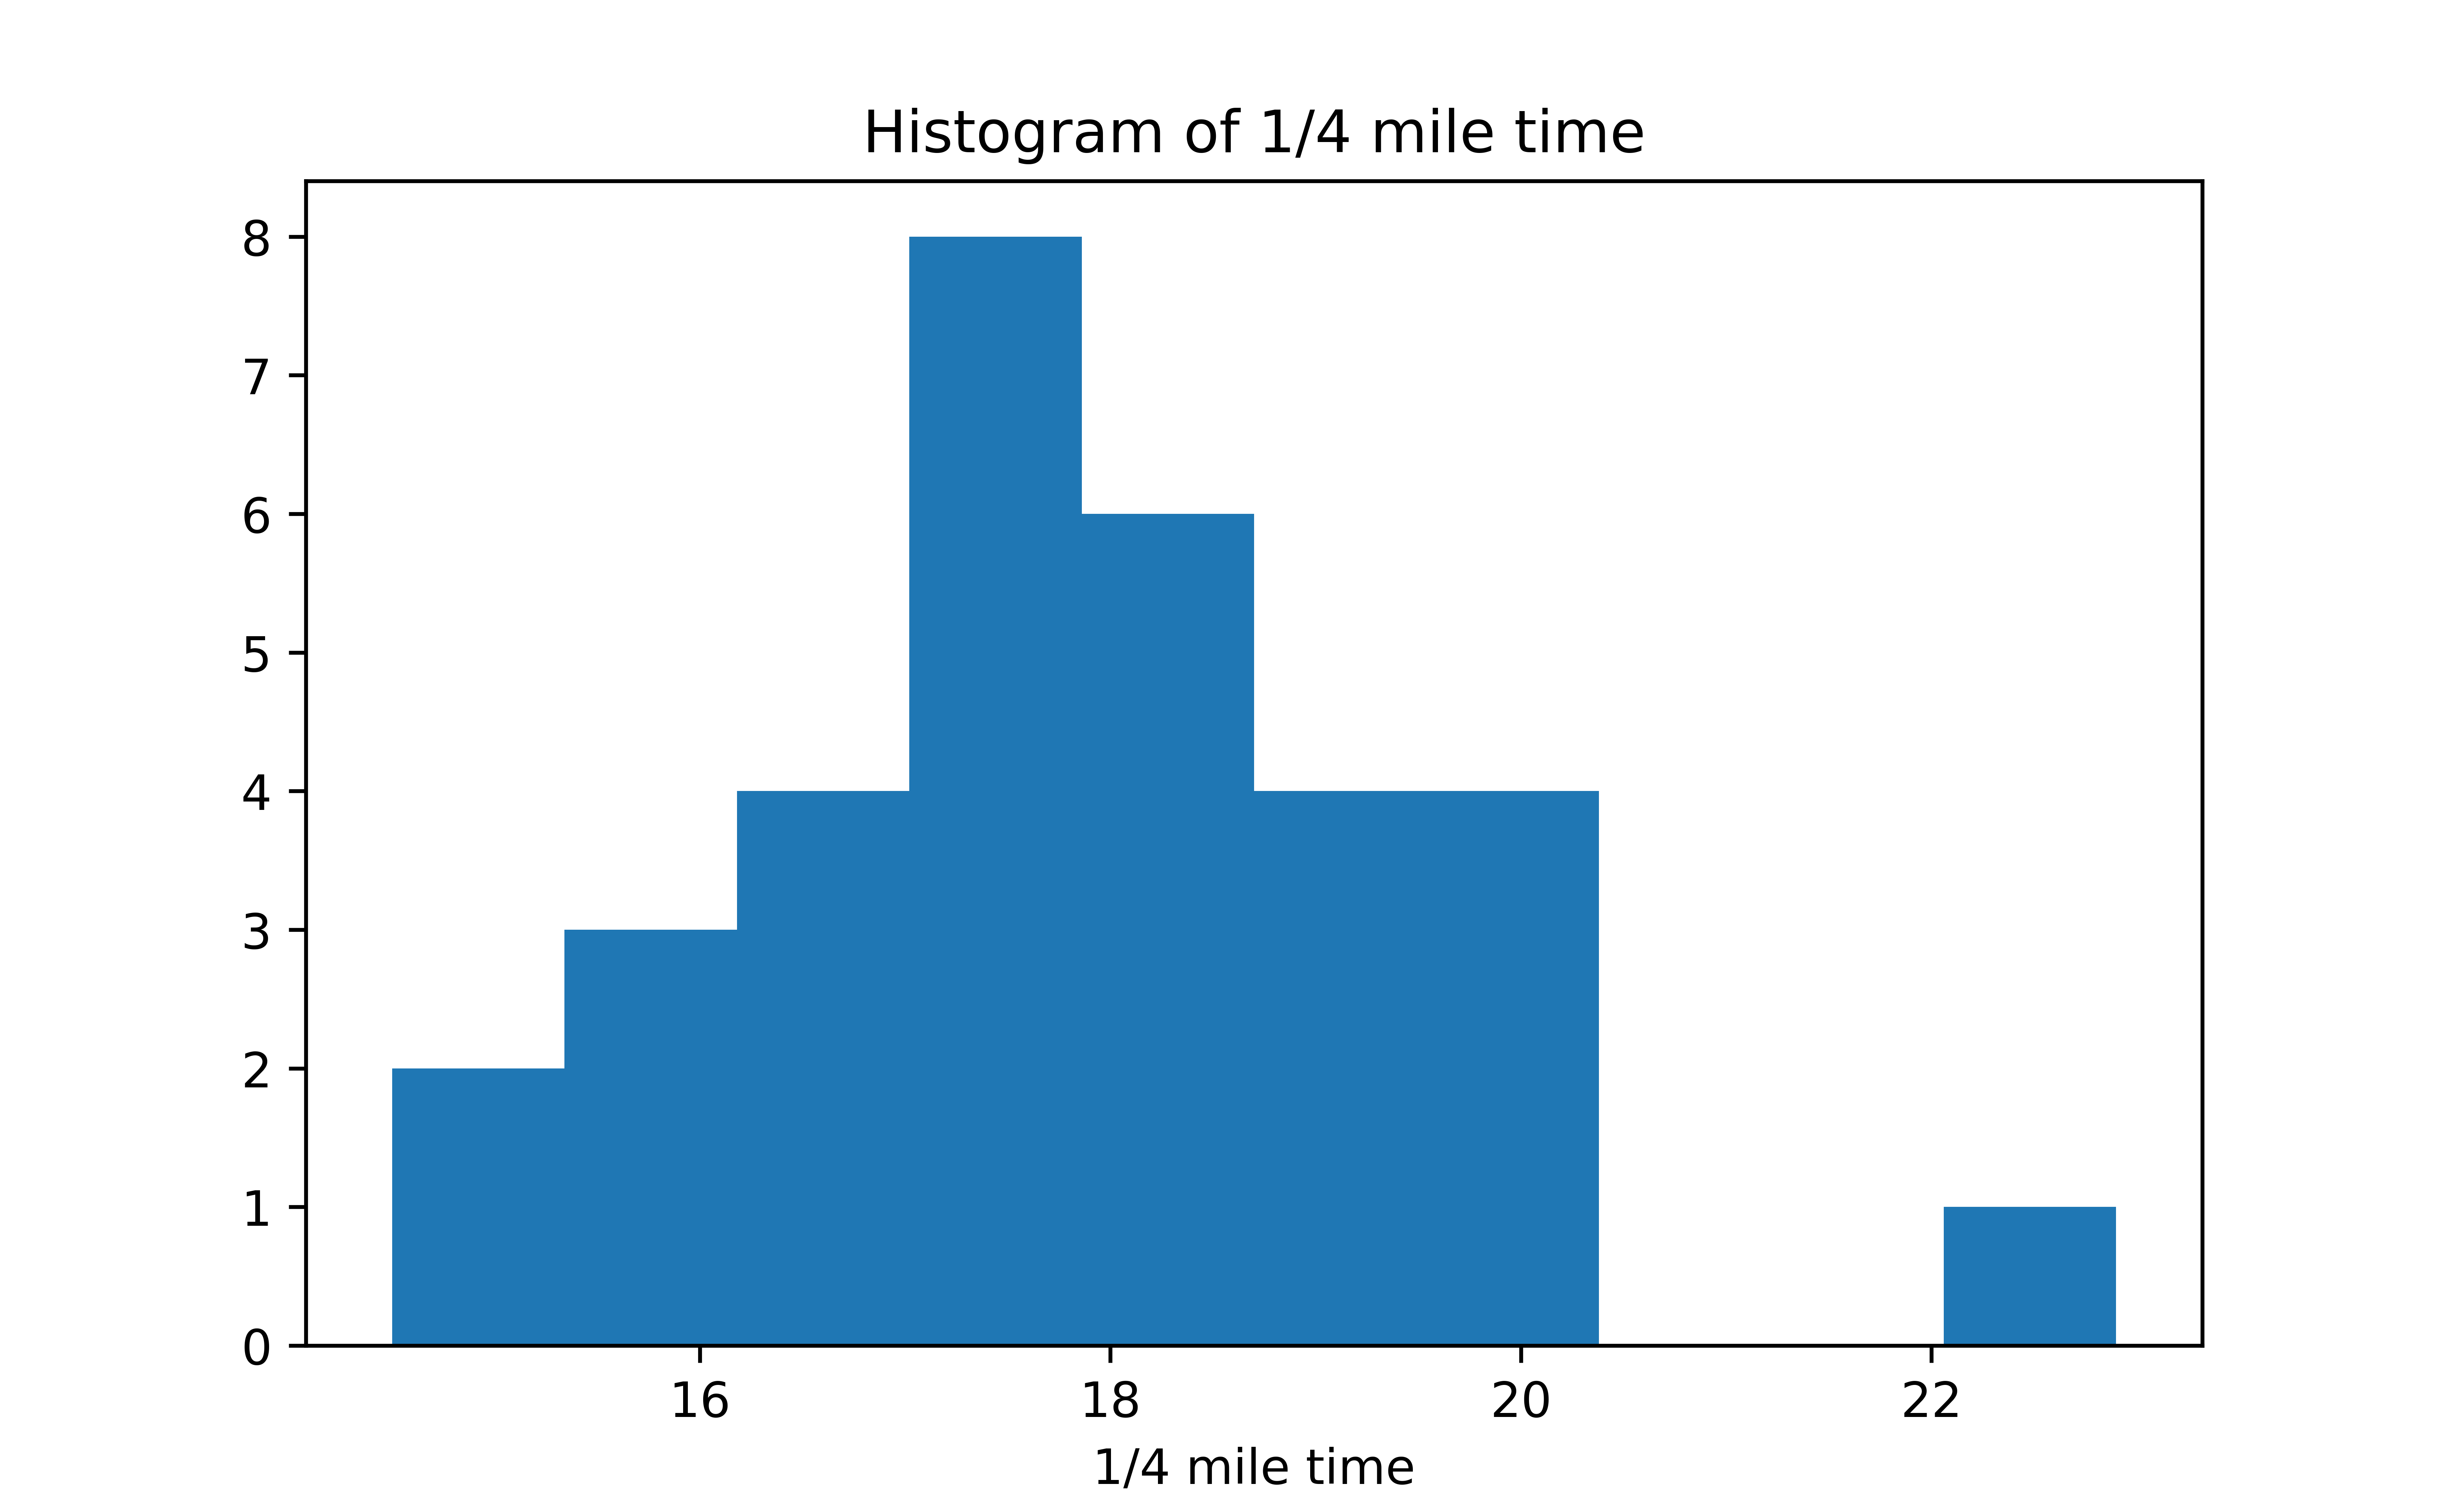
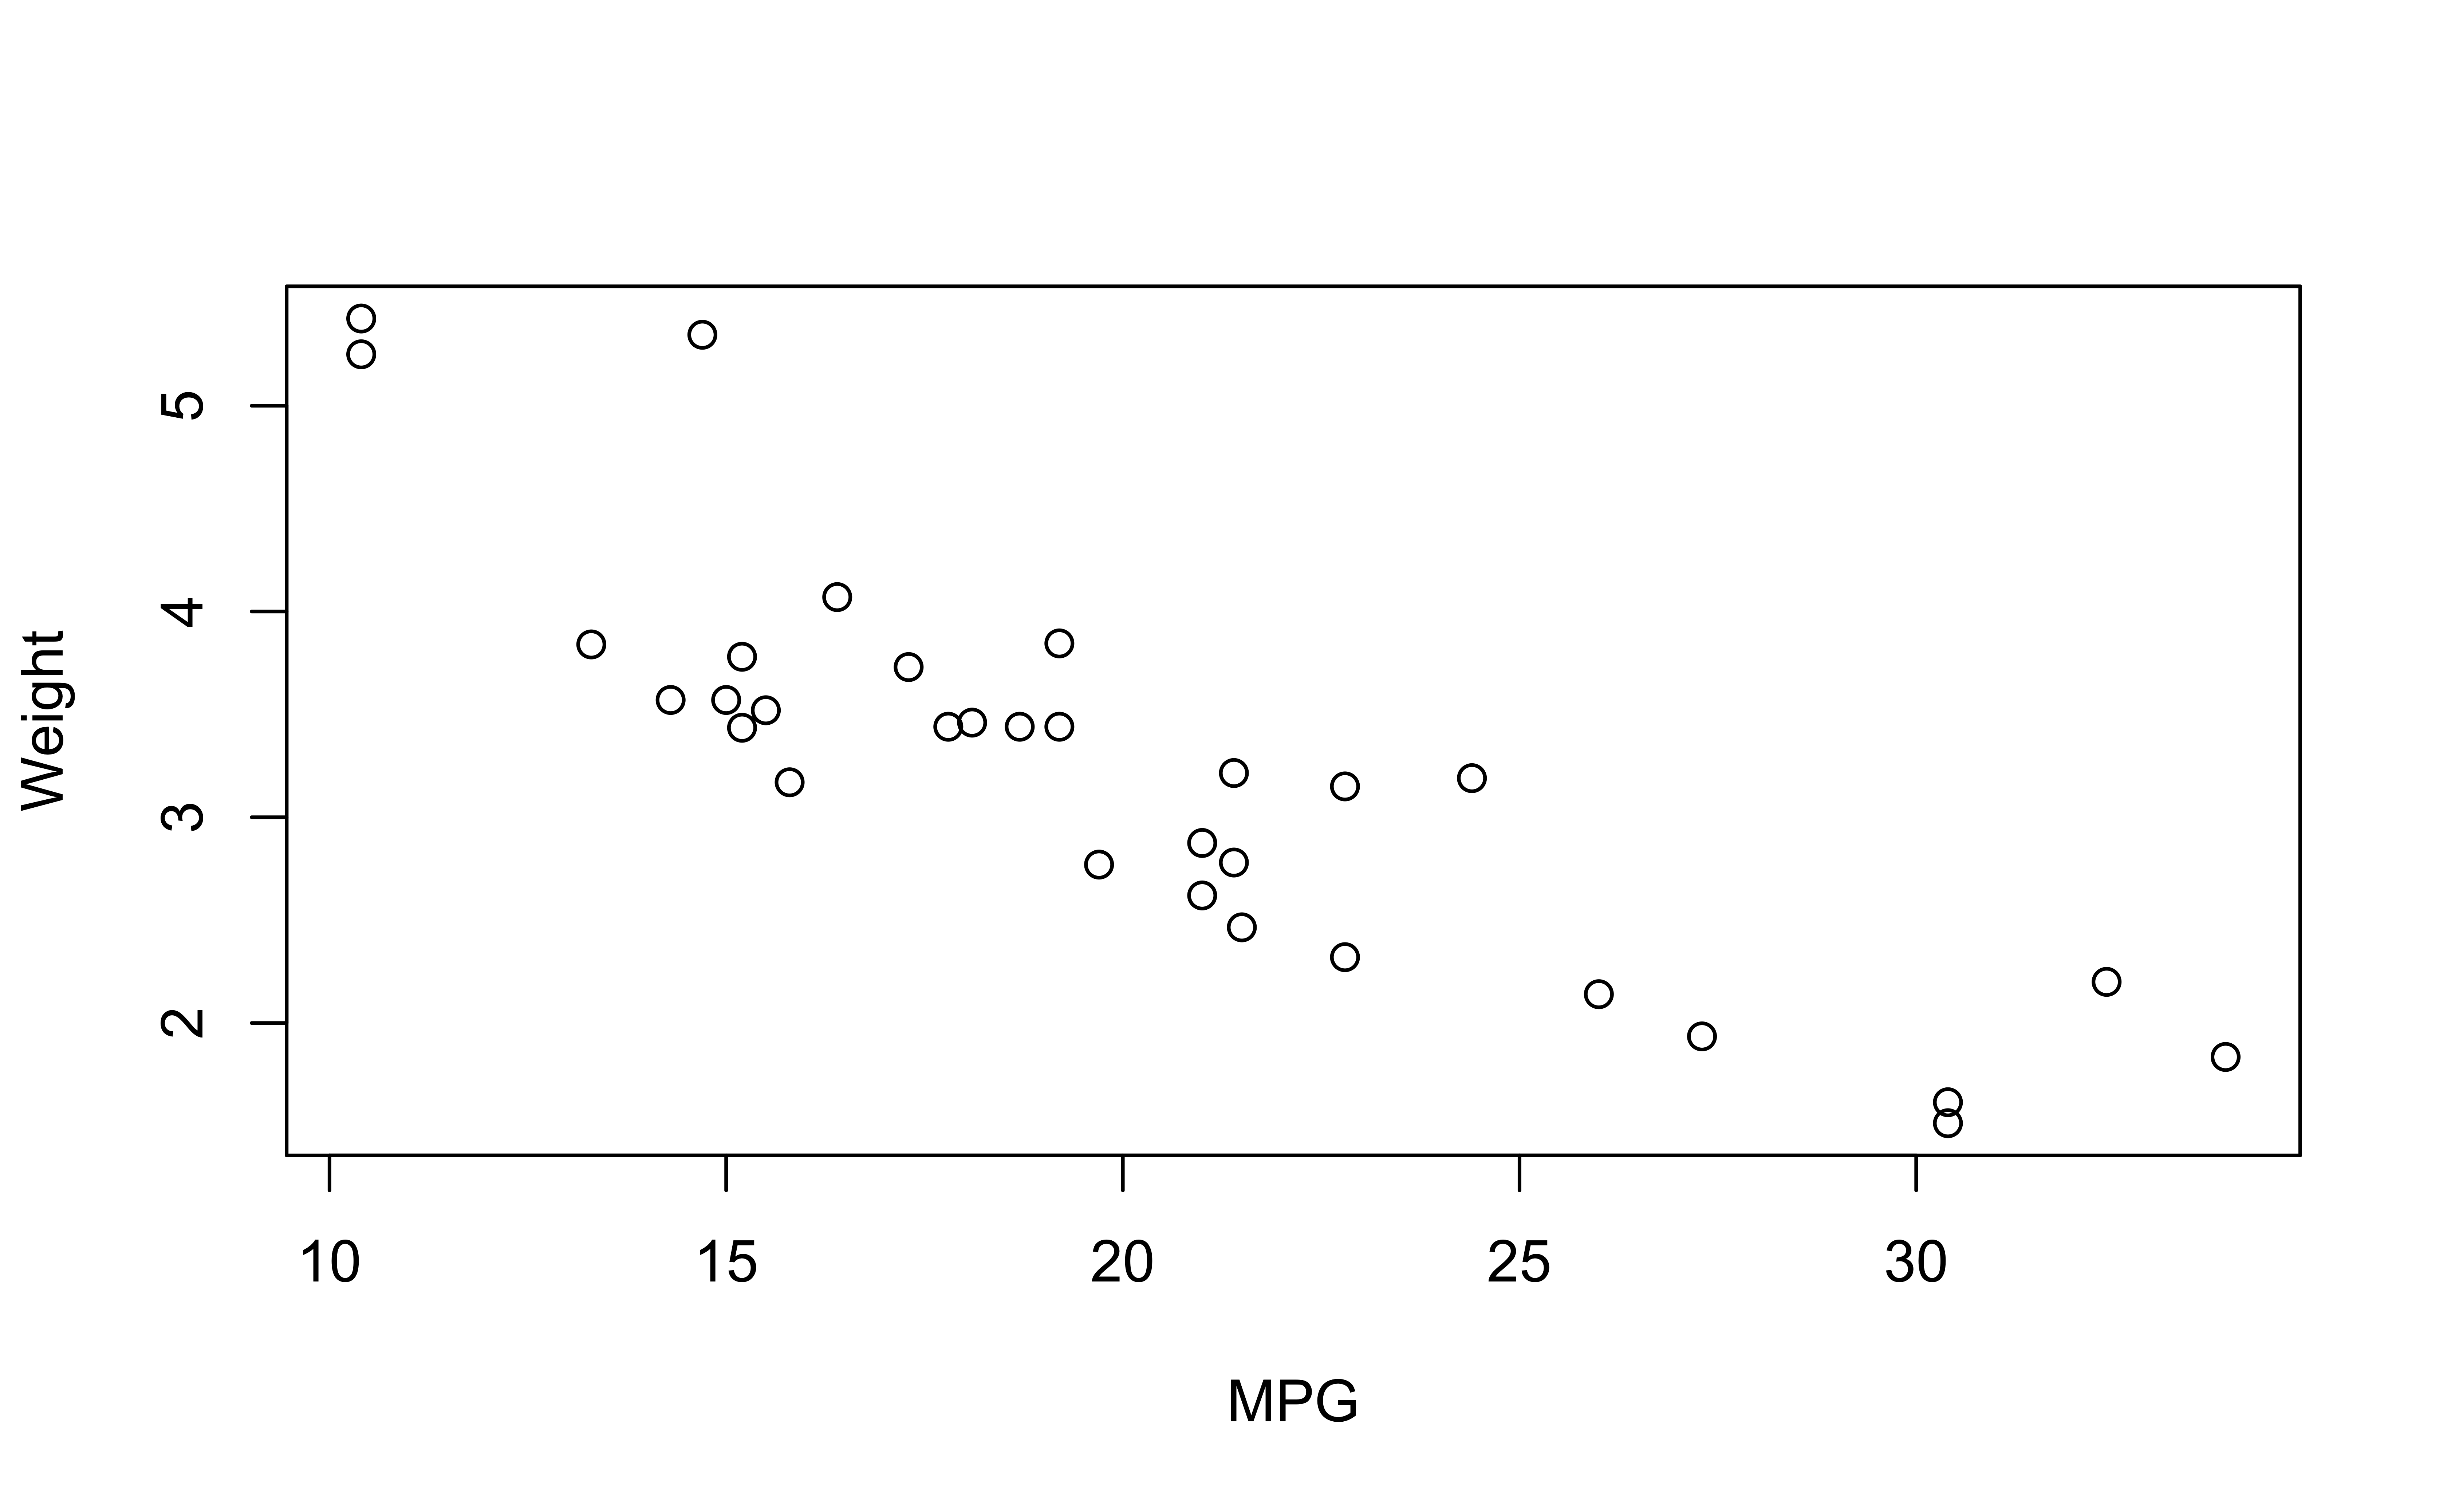
mtcarsdata, use R or Python tomake a scatter plot of
miles per gallonvs.weight. Decorate your plot using arguments,col,pch,xlab, etc.create a histogram of 1/4 mile time. Make it beautiful!
- Commit and Push your work once you are done.