Data Wrangling - two data frames 🛠
MATH/COSC 3570 Introduction to Data Science
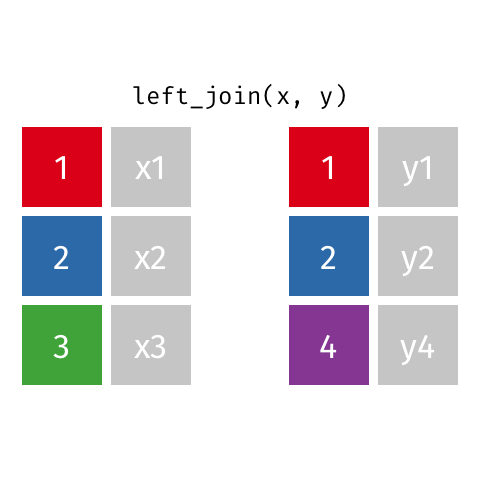
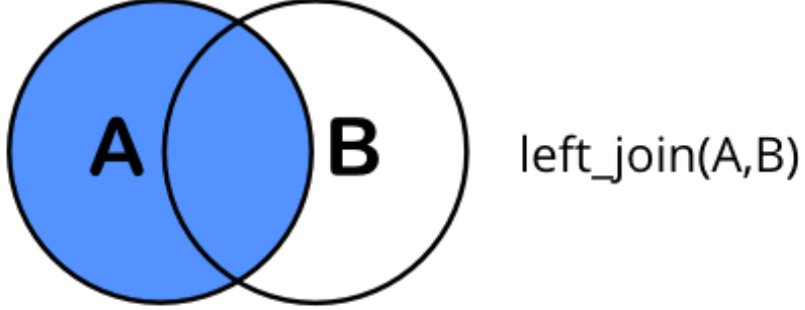
left_join(x, y): all rows from x
## by = keys
left_join(x, y, by = "id")
# A tibble: 3 × 3
id var_x var_y
<chr> <chr> <chr>
1 01 x1 y1
2 02 x2 y2
3 03 x3 <NA> -
NAis added to theidnot appearing iny.
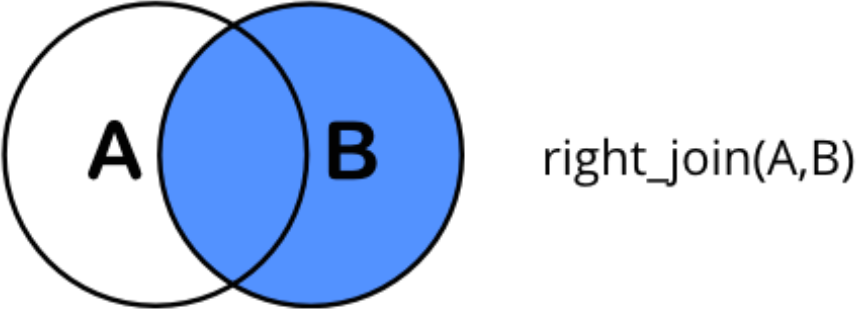
right_join(x, y): all rows from y
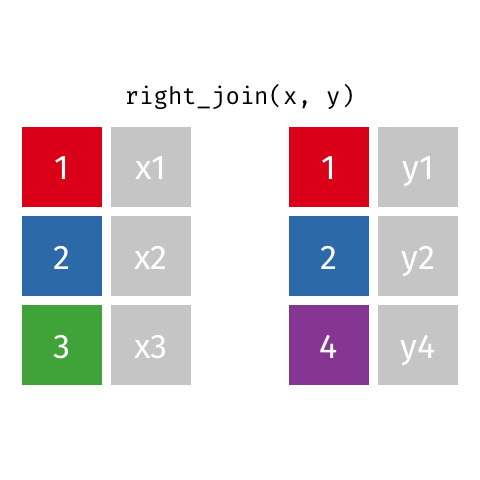
right_join(x, y)Joining with `by = join_by(id)`# A tibble: 3 × 3
id var_x var_y
<chr> <chr> <chr>
1 01 x1 y1
2 02 x2 y2
3 04 <NA> y4 -
NAis in the column coming fromx.
full_join(x, y): all rows from both x and y
full_join(x, y)Joining with `by = join_by(id)`# A tibble: 4 × 3
id var_x var_y
<chr> <chr> <chr>
1 01 x1 y1
2 02 x2 y2
3 03 x3 <NA>
4 04 <NA> y4 - Keep all the rows and fill the missing parts with
NAs.
inner_join(x, y): only rows w/ keys in both x and y

inner_join(x, y)Joining with `by = join_by(id)`# A tibble: 2 × 3
id var_x var_y
<chr> <chr> <chr>
1 01 x1 y1
2 02 x2 y2 - Keep only the rows that have information in both tables.
# A tibble: 53,940 × 4
  carat color Description    Details
  <dbl> <chr> <chr>          <chr>
1  0.23 E     Colorless      Minute traces of color
2  0.21 E     Colorless      Minute traces of color
3  0.23 E     Colorless      Minute traces of color
4  0.29 I     Near Colorless Slightly detectable color
5  0.31 J     Near Colorless Slightly detectable color
6  0.24 J     Near Colorless Slightly detectable color
# ℹ 53,934 more rows
## dplyr::right_join()
pop_x.merge(elec_vote_y, how = 'right')
state population electoral_votes
0 Alabama 4779736.0 9
1 Alaska 710231.0 3
2 Arizona 6392017.0 11
3 California 37253956.0 55
4 Connecticut NaN 7
5 Delaware NaN 3## dplyr::full_join()
pop_x.merge(elec_vote_y, how = 'outer') state population electoral_votes
0 Alabama 4779736.0 9.0
1 Alaska 710231.0 3.0
2 Arizona 6392017.0 11.0
3 Arkansas 2915918.0 NaN
4 California 37253956.0 55.0
5 Colorado 5029196.0 NaN
6 Connecticut NaN 7.0
7 Delaware NaN 3.0## dplyr::inner_join()
pop_x.merge(elec_vote_y, how = 'inner') state population electoral_votes
0 Alabama 4779736 9
1 Alaska 710231 3
2 Arizona 6392017 11
3 California 37253956 55![]()