
Quarto 📖
MATH/COSC 3570 Introduction to Data Science
Hello Quarto


Sharing Data Science Products using Quarto
Why Quarto – Various Types of Output
- Support dozens of static and dynamic/interactive output formats!
Why Quarto1 – Integrate Multiple Languages
Quarto Is Built on Pandoc
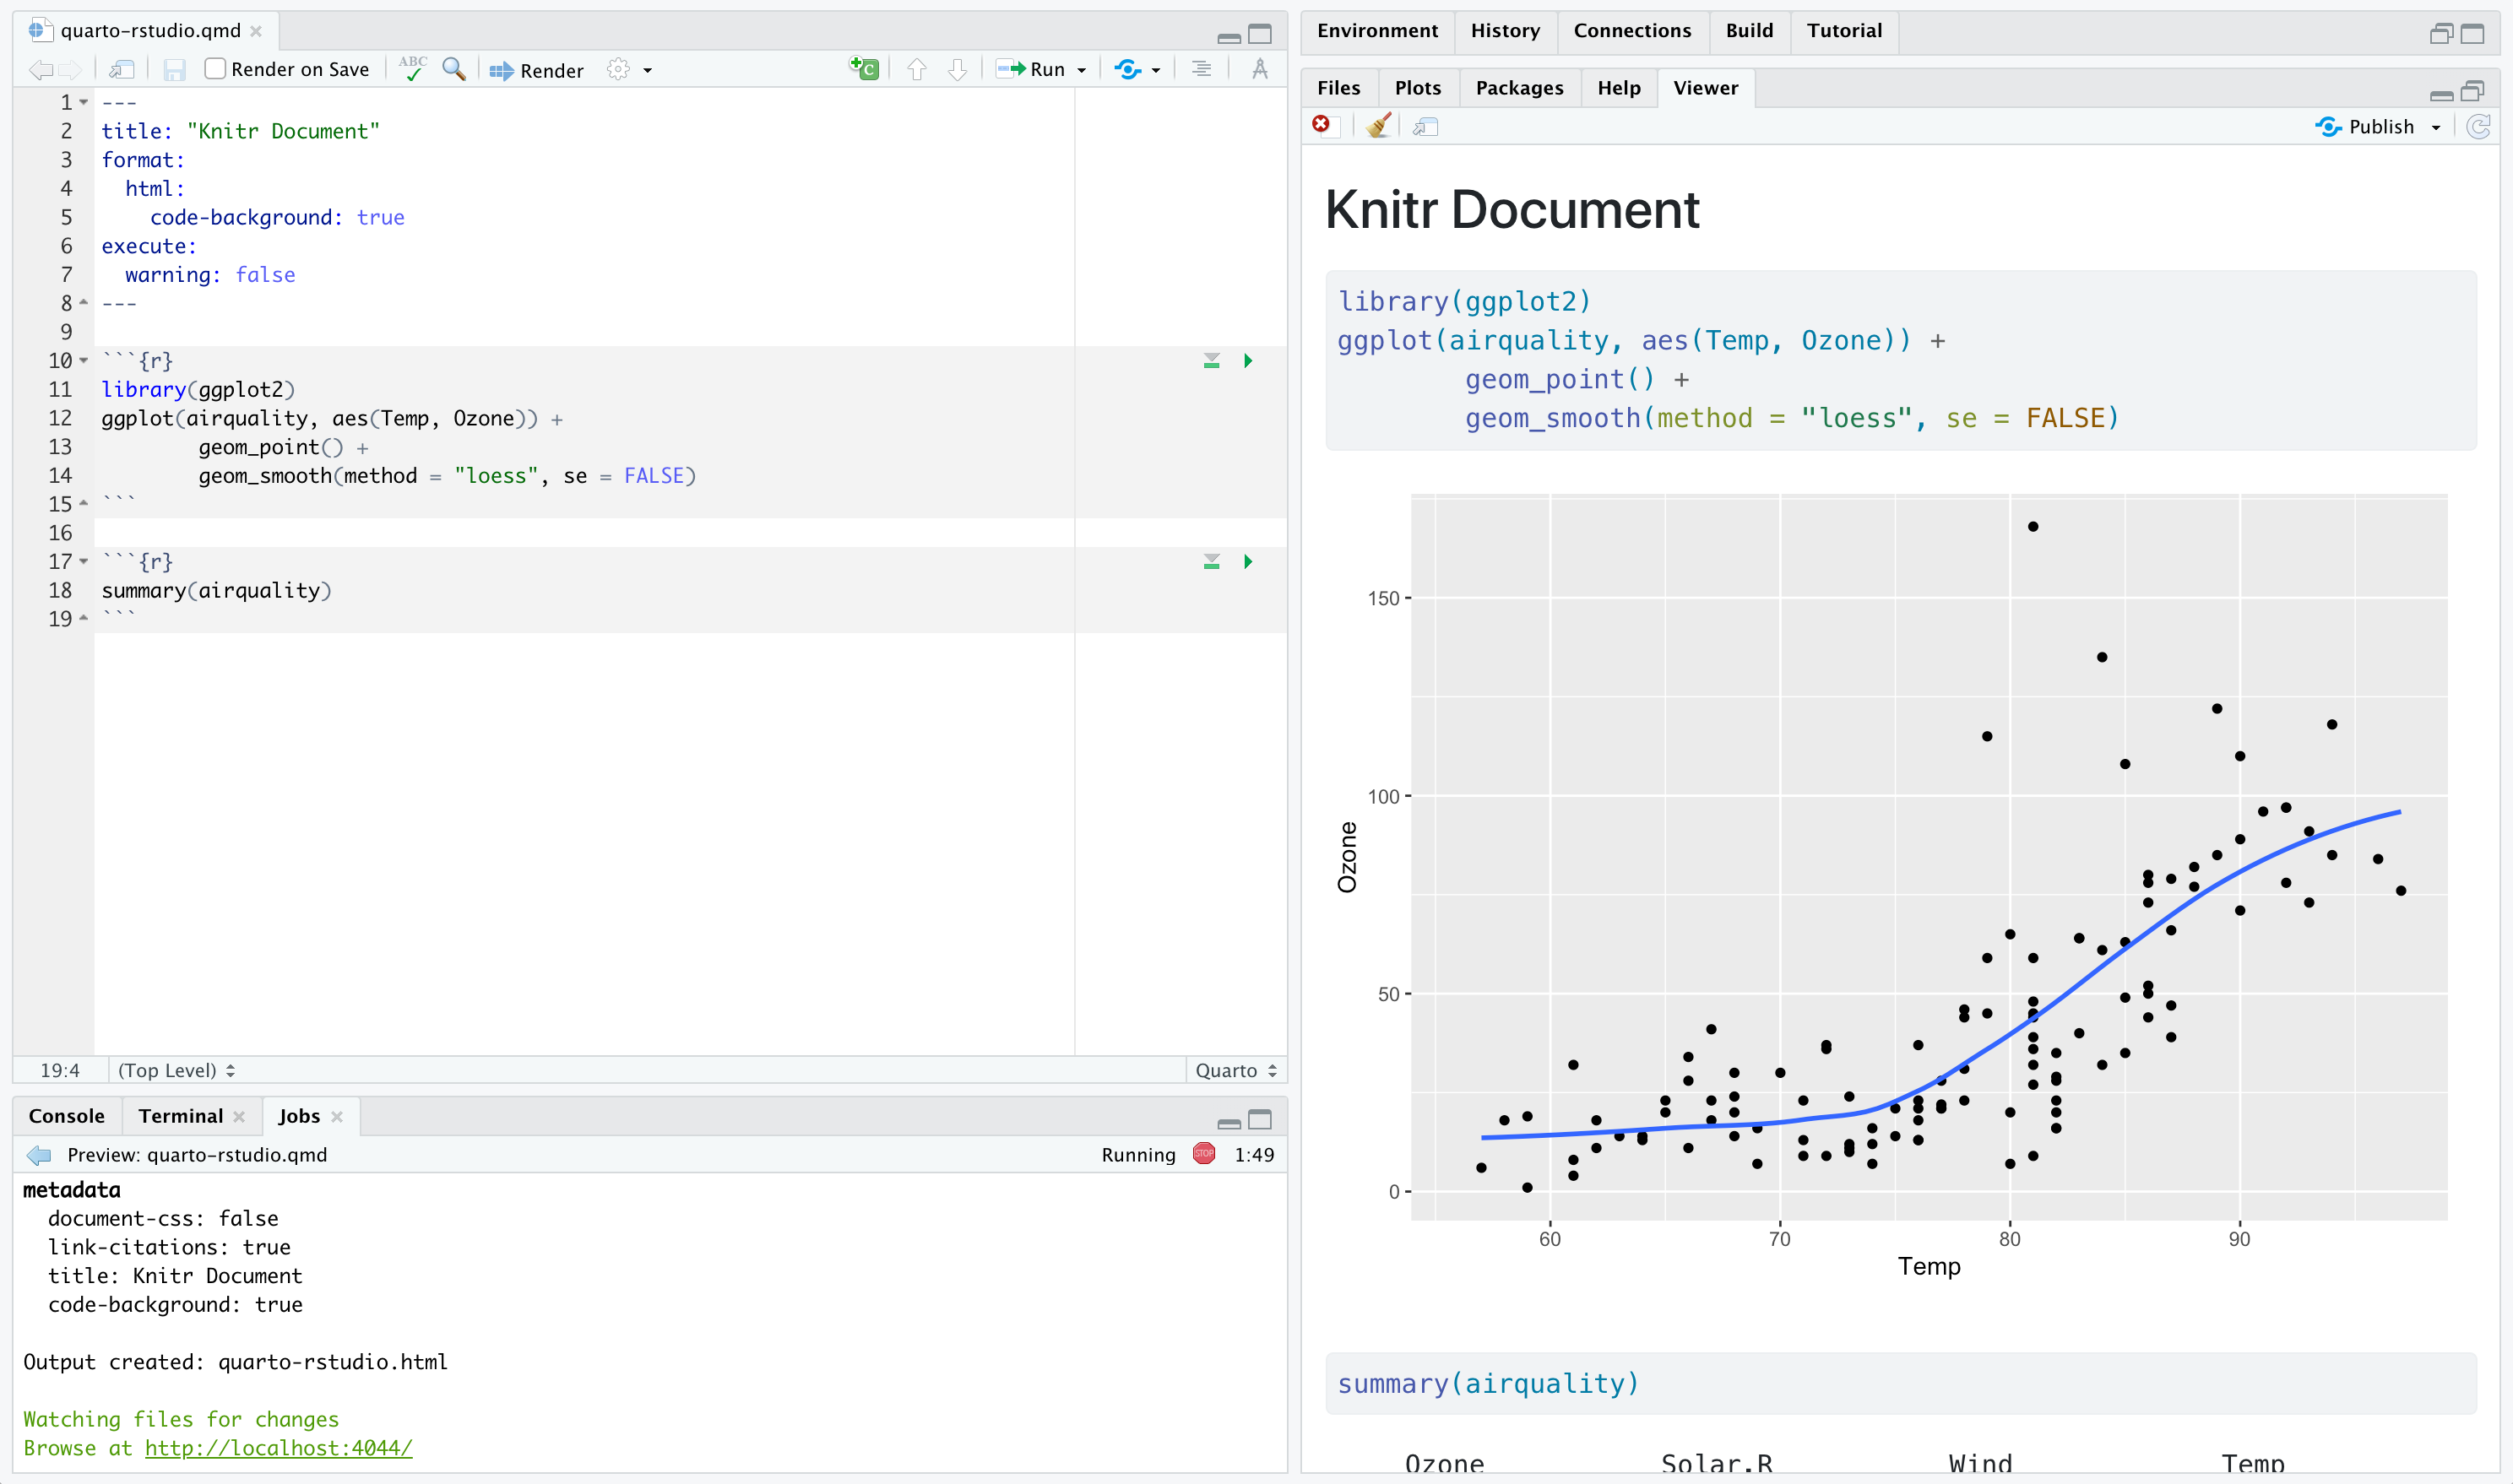
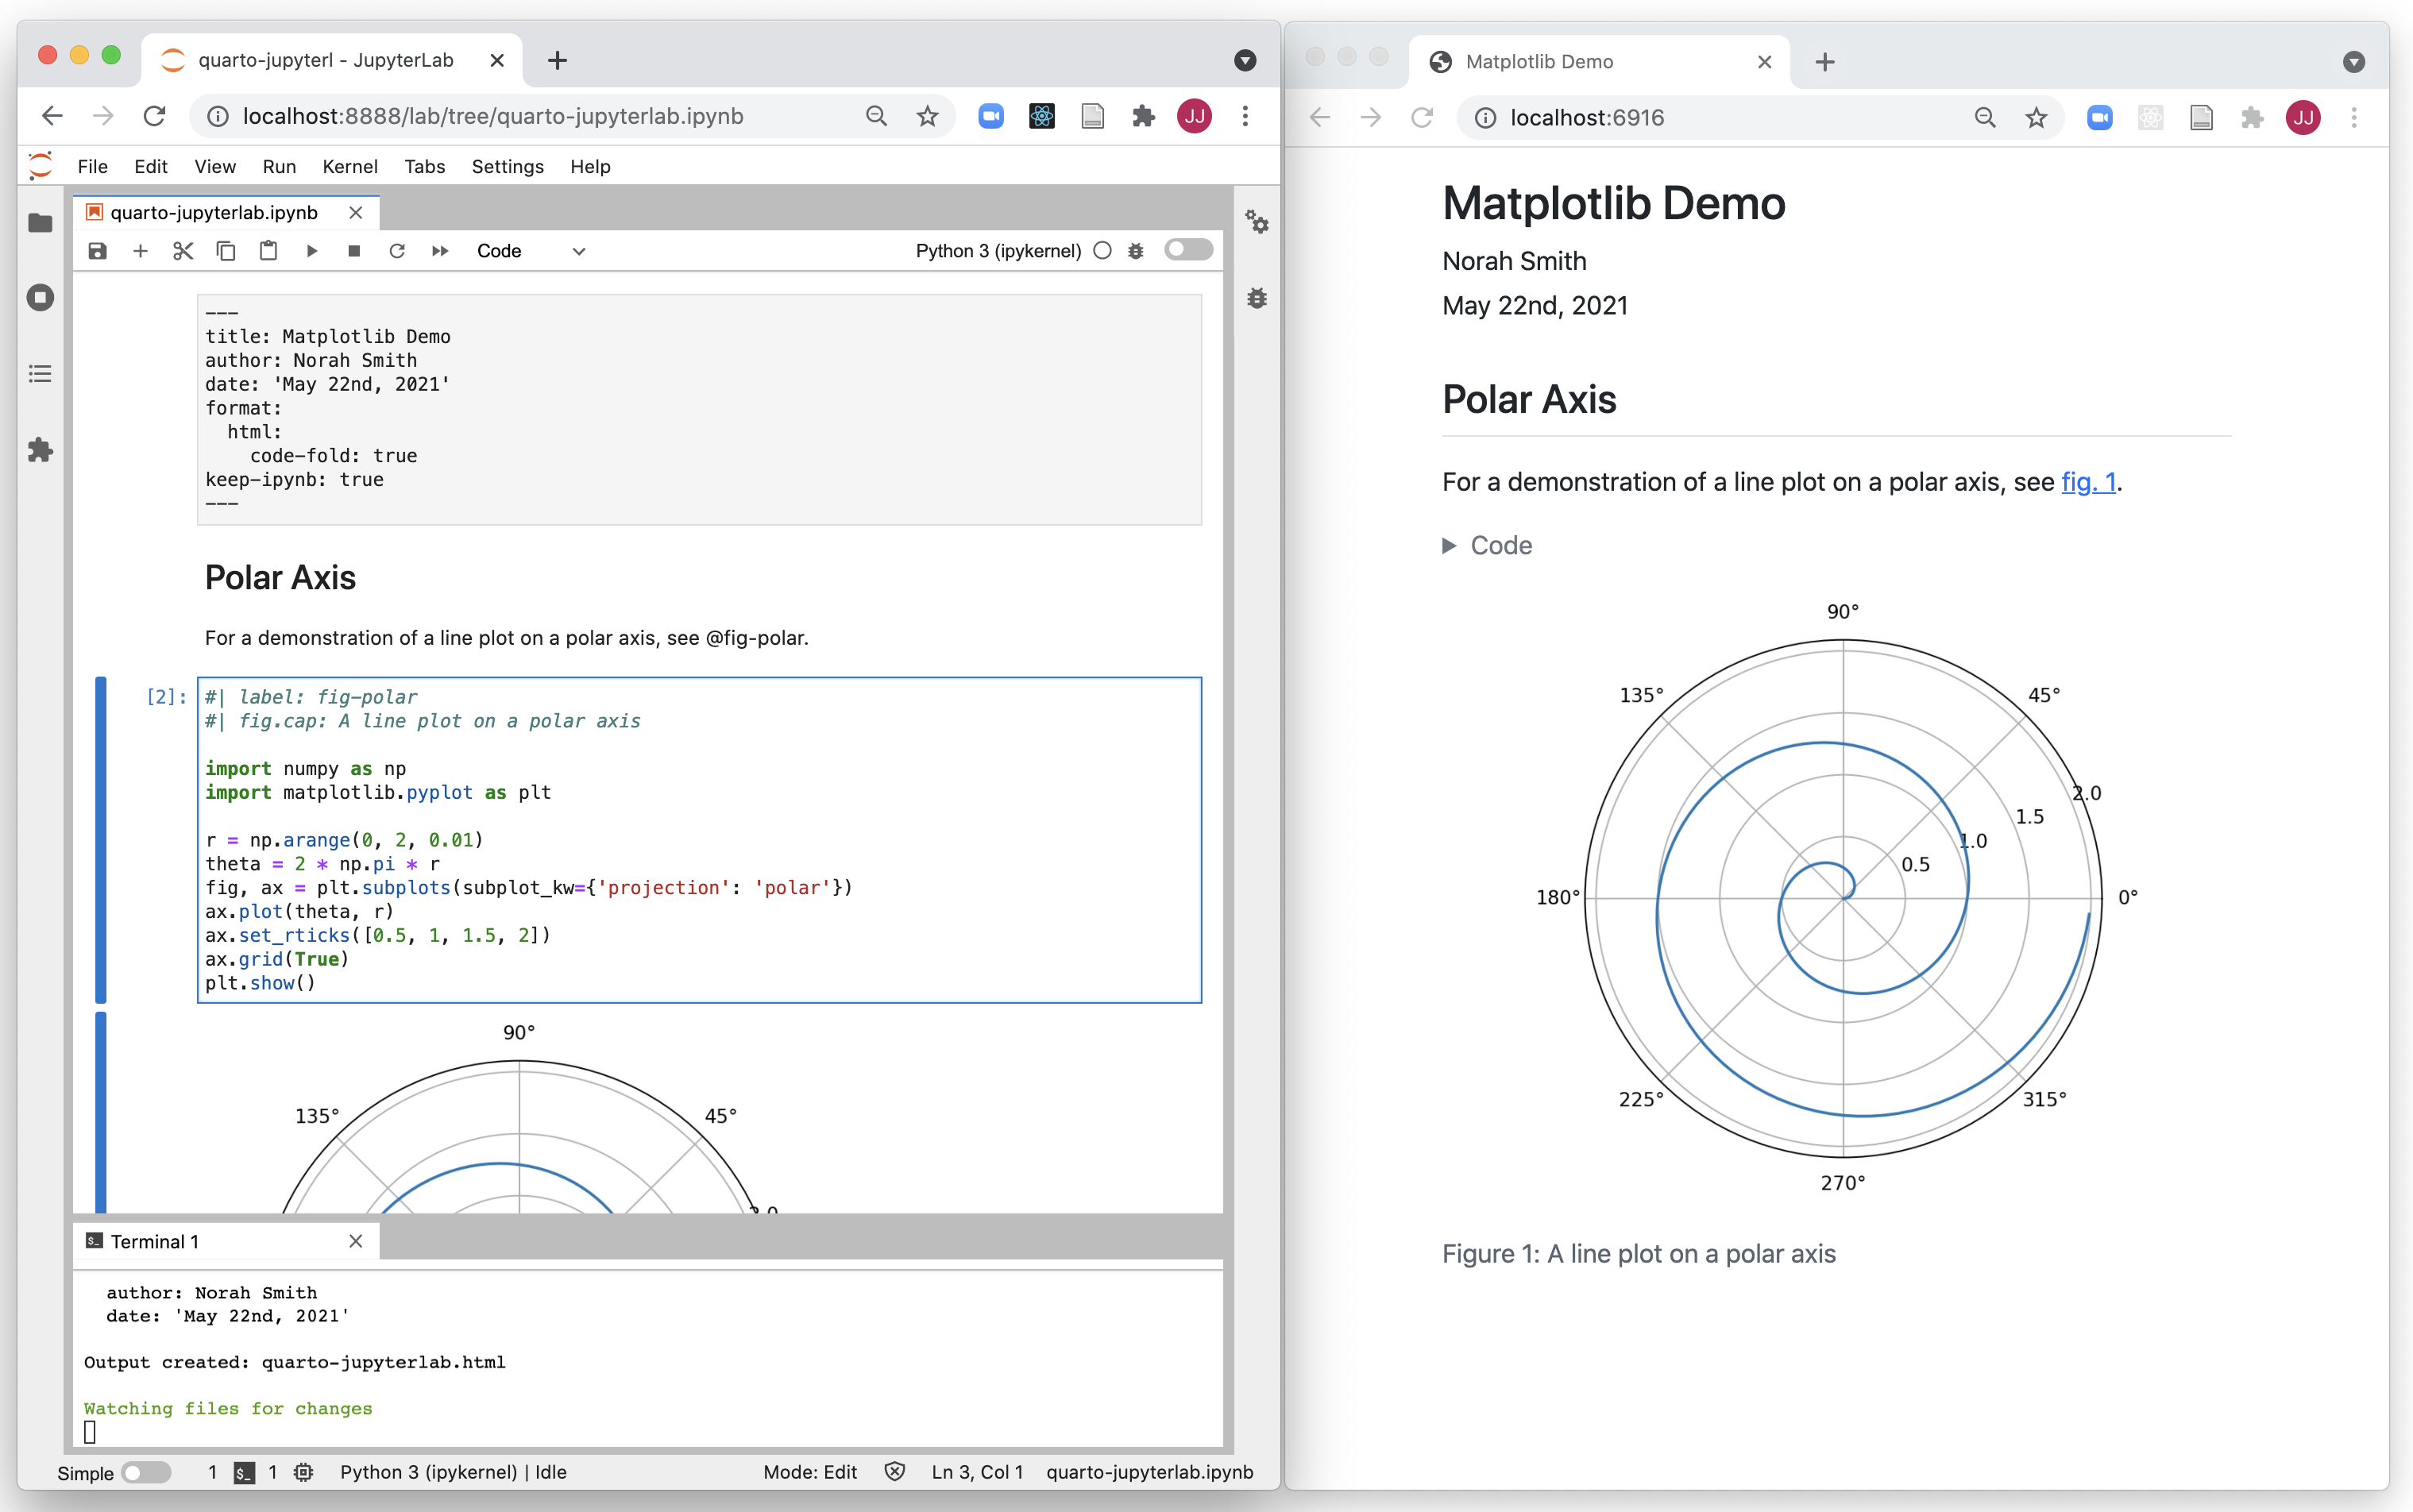
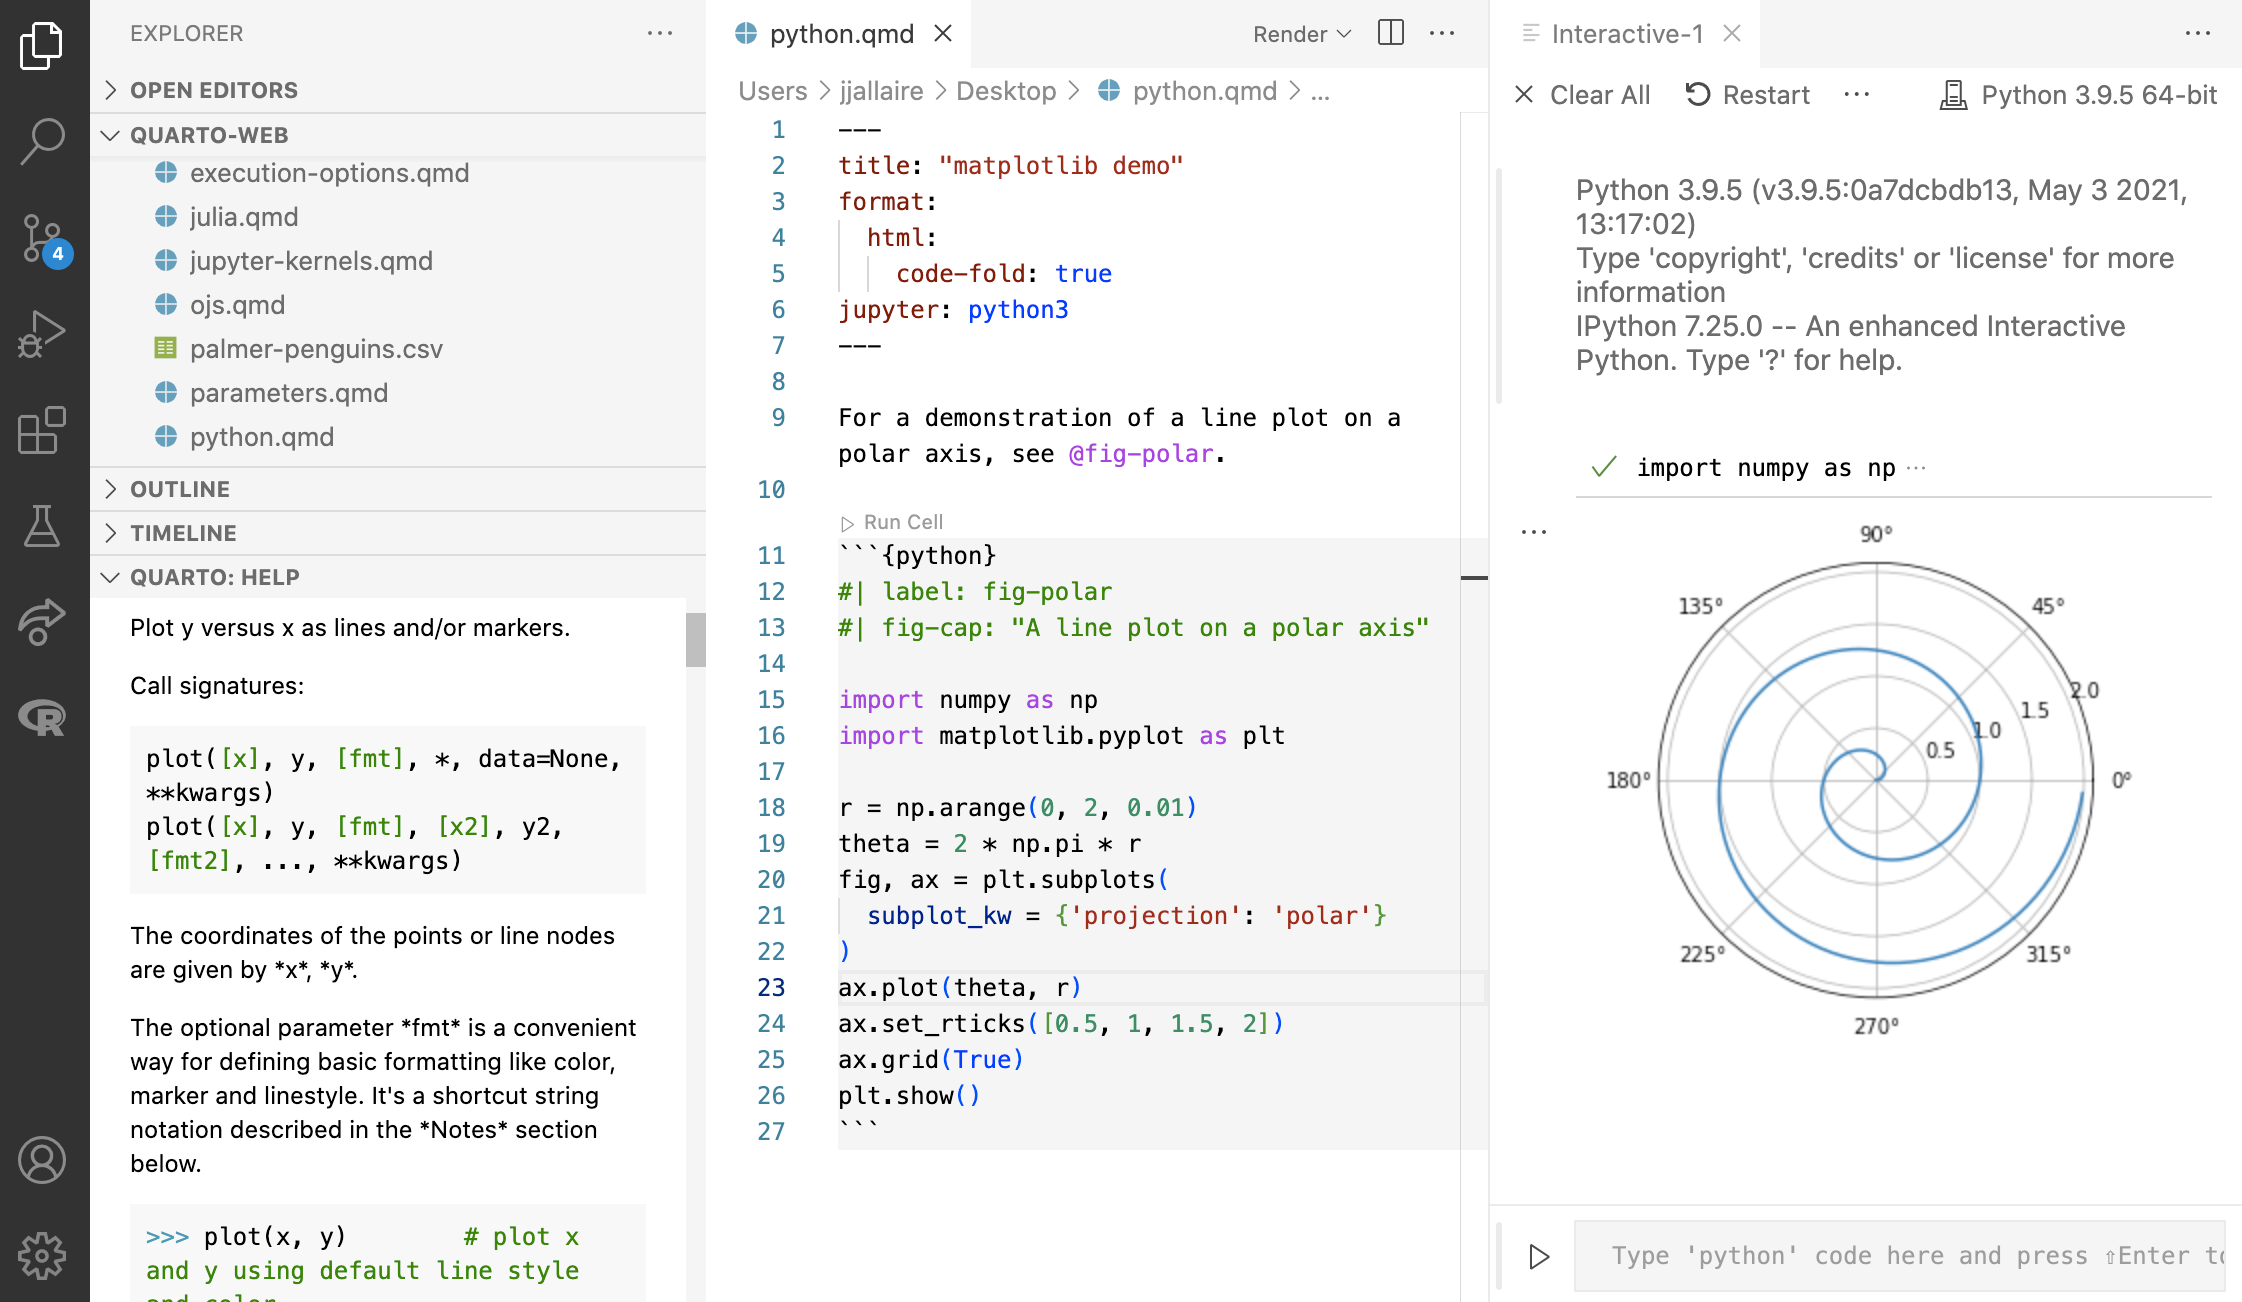
- R uses
knitrand Python/Julia usesJupyterto evaluate our code and turnqmdintomdfile.
Why Quarto – Comfort of Your Own Workspace
Why Quarto – Simple Markdown Syntax for Text
To generate a PDF report, you prefer writing this with 24 lines…
Why Quarto – Simple Markdown Syntax for Text
Or this with 250 lines!?
Markdown
- Quarto is based on markdown, a markup language that is widely used to generate HTML pages.
- Markdown is a lightweight and easy-to-use syntax for styling the writing on the GitHub platform.
- Go through basic (Pandoc’s) Markdown syntax together, and you can learn more at:

02-Quarto File
Go to your GitHub repo lab-yourusername. Clone it to your Posit Cloud as a project in 2025-Spring-Math-3570 workspace.
Open the file lab.qmd.
Change
authorin YAML.
Click on
![]() or
or Ctrl/Cmd + Shift + Kto produce a HTML document.How can we show the current date every time we compile the file? [Hint:] Check your hw00. Compile your document and make sure the date shows up.
 or
or How do we fold the code so that the document is shorter? Describe it in
## Lab 2: QuartoOnce done, commit with message “02-quarto” and push it to GitHub.
Source vs. Visual Mode
Source Mode

Visual Mode (What You See Is What You Mean (WYSIWYM))

Anatomy of a Code Chunk
```{r}
#| label: car-stuff
#| eval: false
mtcars |>
  distinct(cyl)
```
```{python}
#| label: string
#| eval: false
x = 'hello, python world!'
print(x.split(' '))
```Has 3x backticks
```on each endTo insert a code chunk,
![]()
Alt + Ctrl + I(Win) ;Option + Cmd + I(Mac)Indicate engine (
r) between curly braces{r}Place options behind the
#|(hashpipe):#| option: valueTools > Modify Keyboard Shortcuts > Filter… > Insert Chunk Python >
Option + Cmd + P(or any key binding you like)
Global Options: execute
- Should be specified within the
executekey.
---
execute:
  echo: false
  eval: false
---- Check HTML Options > Execution for more execution options!
Images
Basic markdown syntax:

Maru
Figures w/ code
```{r}
#| out-width: 40%
#| fig-align: right

knitr::include_graphics("images/05-quarto/maru1.jpg")
```Including Plots
- Many chunk options for figures and images start with
fig-, for examplefig-width,fig-height,fig-show, etc.
```{r}
#| eval: false
#| fig-cap: "Fig. 1: Car stuff"

plot(x = cars$speed, y = cars$dist)
```
Subfigures Fenced div Class
::: {#fig-maru layout-ncol=2}
{#fig-loaf width="250px"}
{#fig-lick width="250px"}
Two states of Maru
:::

Quarto Skills to the Next Level
![]()